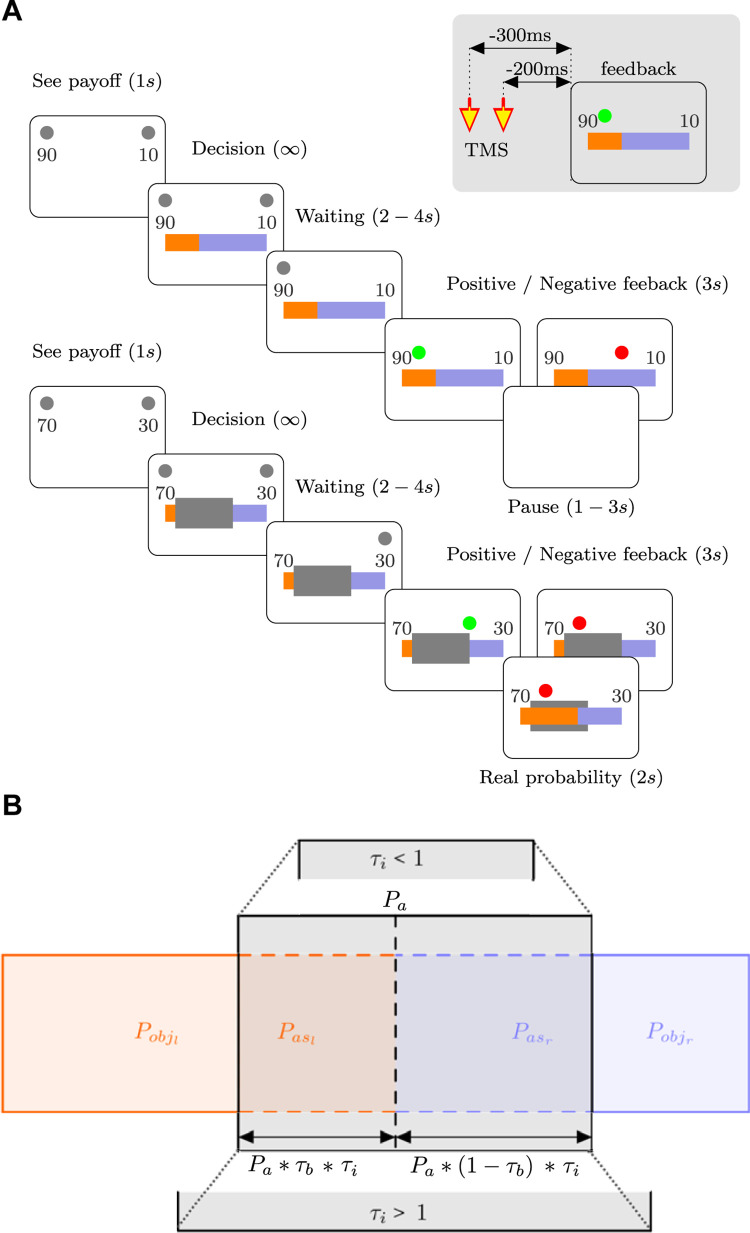
Fig 1. Probability decision-making task.
(A) Task timeline. Participants were asked to decide between 2 options (left or right option). Each option had an associated reward indicated by a number. After a decision was made with a variable waiting time, feedback was provided. A green circle indicates that the participant won, whereas a red circle signals that he/she did not. In the ambiguity condition (bottom panel), a gray mask partially hides the color bars extension in the division. During the TMS-EEG session, a double TMS pulse is delivered −300 and −200 ms before feedback presentation, as represented in the gray rectangle over the superior right corner. (B) Schematic representation of the objective probabilities (Pobj) and assigned probabilities (Pas), and the relationship among the ambiguity probability (Pa) and the model parameters, τi and τb (see the Results and Materials and methods sections for details).

