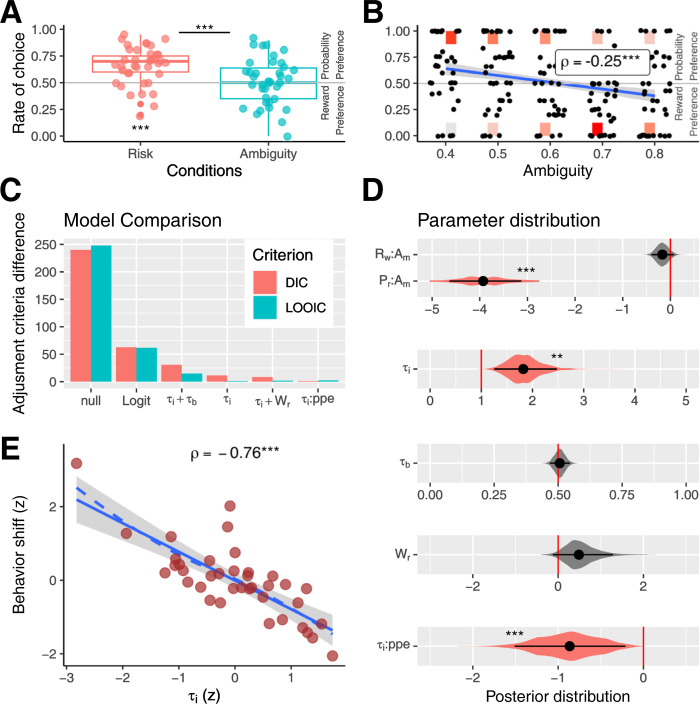
Fig 2. Behavioral results.
(A) Rate of choice where individuals preferred the highest probability per conditions. (B) Rate of choice where subjects preferred the highest probability per degree of ambiguity. Black dots represent the rate per individual. Color rectangles indicate the number of individual decisions; red represents the maximum, and light gray represents the minimum account. The blue line represents the linear regression, and the gray area is the standard error. (C) Model fitting comparison using DIC, red, and LOOIC, green. (D) Posterior distribution of the key parameters for each model. Black dots represent the mean of the distribution, and black lines the 95% HDIs. The colored areas represent the complete posterior distribution. (E) Correlation between decision shift (difference between the rate of choices that the subject prefers the highest probability between condition, ambiguity less no-ambiguity conditions), and τi parameters. Red dots represent each subject. The solid blue line represents the linear regression, the dotted blue line the LOESS regression, and the gray area represents the standard error; * indicates p < 0.05, ** p < 0.01,***p < 0.001. See also S1 Fig and S1 Table. The data underlying this figure can be found at https://osf.io/zd3g7/. DIC, deviance information criterion; HDI, high-density interval; LOOIC, leave-one-out cross-validation information criterion.

