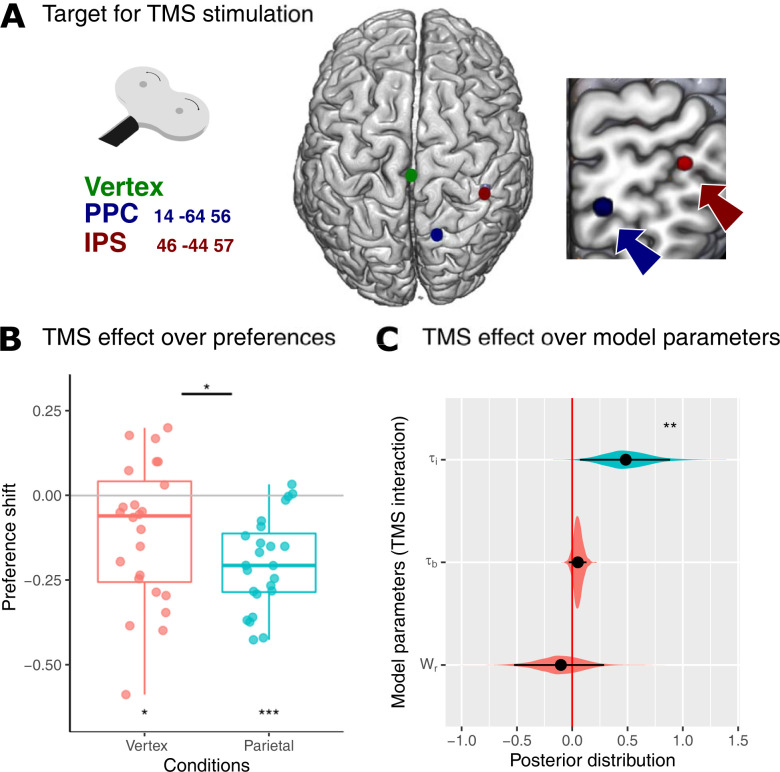
Fig 4. Behavioral result of interleaved EEG-TMS experiments.
(A) Target areas for TMS stimulation (right PPC x = 14, y = −64, z = 56; right IPS x = 46, y = −44, z = 57, and Scalp Vertex). (B) Decision shift (difference between the rate of choices subjects prefer with the highest probability between conditions, no-ambiguity less ambiguity) comparison between Vertex and Parietal TMS stimulation. (C) Posterior distribution effect of TMS stimulation on key parameters for cognitive models. Black dots represent the mean of the distribution, and black lines represent the 95% HDIs. The colored areas represent the complete posterior distribution. The data underlying this figure can be found at https://osf.io/zd3g7/. HDI, high-density interval; IPS, intraparietal sulcus; PPC, posterior parietal cortex.

