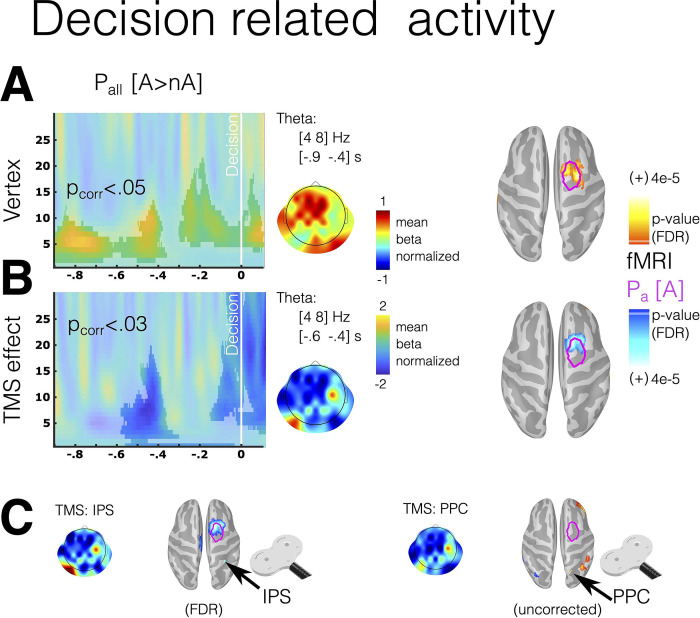
Fig 6. Oscillatory brain activity in frontal electrodes associated with the probability of the chosen option during the decision period.
(A) The time-frequency chart illustrates differences in frontal electrodes between the Ambiguity and No-ambiguity conditions in the correlation between oscillatory power and the probability of the chosen option (Pall[A > nA]). (B) The joint effect of 2 models, one for Vertex TMS stimulation and the other for the difference between Vertex TMS and parietal TMS stimulation (TMS effect). (C) A separate analysis of theta activity for TMS stimulation in IPS and PPC is conducted. (A, B) The highlighted areas indicate time-frequency epochs with significant modulation, determined using a cluster-based permutation test (CTD: p < 0.05, Wilcoxon test). (A–C) Scalp topographies display oscillatory activity in the theta range. Source estimation for theta activity is provided for Vertex and the TMS effect. Magenta lines on the cortex represent areas where BOLD activity correlates with Pa in the fMRI experiment (see Fig 3). All source results are presented on a high-resolution mesh for visualization purposes only. The data underlying this figure can be found at https://osf.io/zd3g7/. CTD, cluster threshold detection; IPS, intraparietal sulcus; PPC, posterior parietal cortex.

