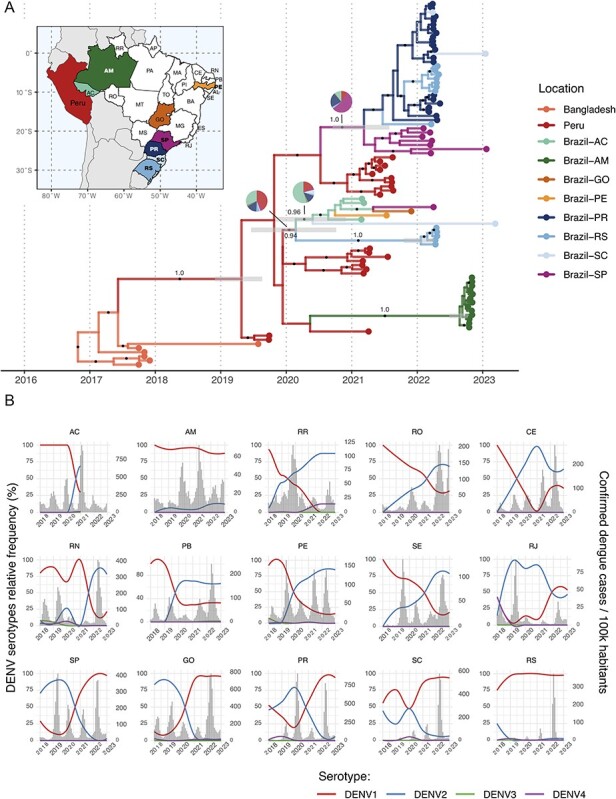
Figure 1.

Spatiotemporal evolution of DENV-2 genotype II (Cosmopolitan) in South America and circulation dynamics of DENV serotypes in Brazil in recent years. (A) Time-scaled phylogenetic tree of eighty-eight DENV-2-GII genomes with ancestral locations inferred by the phylogeographic model. The branches are colored according to the most likely ancestral location, and pie charts show the posterior probability of each location for key nodes with high uncertainty. Error bars show the 95 per cent HPD of node heights related to introductions to Brazil. The dots on branches indicate a posterior probability higher than 0.9, and key branches are annotated with the posterior support. Inset map depicts the Brazilian states from which DENV-2 sequences were sampled. Colors on the map and phylogenetic tree correspond and the states directly sampled in this study are highlighted in bold. (B) The relative frequency of each DENV serotype (lines) and confirmed dengue cases per 100k habitants (histogram) for a selection of Brazilian states between 2018 and 2022. The acronyms for depicted states: AC—Acre, AM—Amazonas, RR—Roraima, RO—Rondônia, CE—Ceará, RN—Rio Grande do Norte, PB—Paraíba, PE—Pernambuco, SE—Sergipe, RJ—Rio de Janeiro, SP—São Paulo, GO—Goiás, PR—Paraná, SC—Santa Catarina, and RS—Rio Grande do Sul.
