Figure 2.
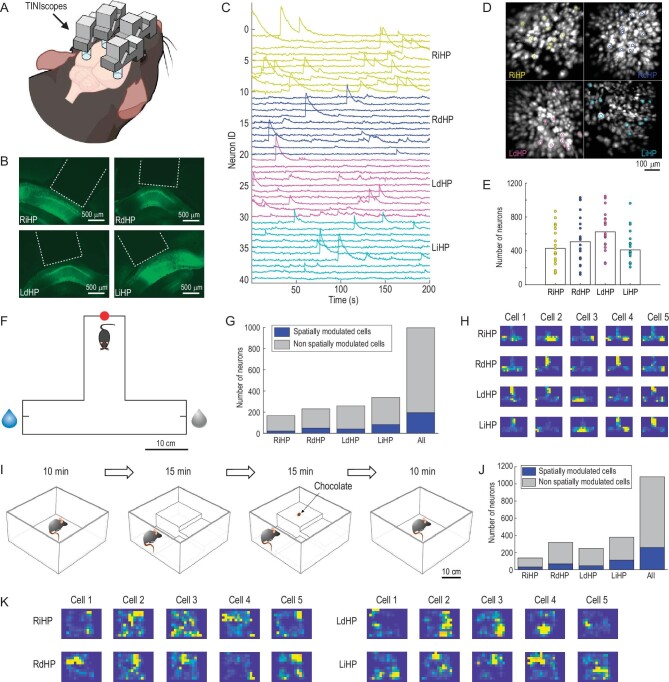
Simultaneous calcium imaging of 4 hippocampal subregions in different behavioral experiments. (A) Diagram of 4-region recordings in mice. (B) Fluorescence images of brain slices around the four recorded hippocampal subregions. The white dashed lines indicate GRIN lenses. (C) Calcium traces of example neurons from the RiHP (yellow), RdHP (blue), LdHP (magenta), and LiHP (cyan). (D) The spatial contours of example neurons in (C) and the corresponding maximum intensity map (MIP) of the background-subtracted videos. (E) Number of identified neurons in all sessions and their averages (n = 20 sessions, 6 mice). (F) Paradigm of the T-maze task. The water reward was given at a random end in each trial. Red dot: start point; blue droplet: reward side; gray droplet: non-reward side. (G) The proportion of spatially modulated cells during the T-maze task. (H) Place fields of example spatially modulated cells in the T-maze box. (I–K) same as (F–H) but the mouse was in an open field exploration experiment. The mouse explored freely in an open field with changing environments.

