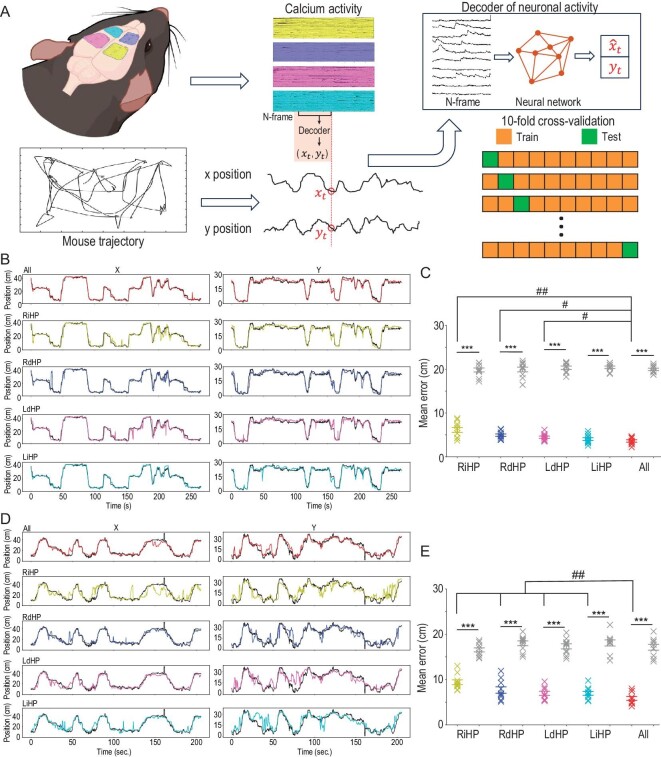
Figure 4.
Decoding mouse position from extracted neuronal traces. (A) Schematic illustration of machine-learning–based decoders for predicting mouse position from neuronal activity. Bottom right: the extracted calcium traces were split into 10 folds, and one testing fold was sequentially chosen to calculate the decoding error with the decoder trained from the remaining 9 folds. Decoding the position at each time point requires the population neuronal activity of the previous N (here, N = 5) frames. The LSTM network was used as the decoding model in this work. (B) Example of decoded mouse positions (color lines) on testing data and the true position (black lines) in the T-maze experiment. The number of temporal bins in this testing fold is 2670 (bin size = 100 ms). (C) The mean decoding error using different sets of neuronal traces in the T-maze experiment. Gray data points correspond to the chance level decoding errors where the mouse positions were randomly shuffled. ***P < 0.001, Mann–Whitney test, n = 10 folds, 1 mouse. ##P < 0.01, #P < 0.05, Wilcoxon matched-pairs sign rank test, n = 10 folds, 1 mouse. The results show the mean ± s.e.m. (D and E) same as (B and C) but the mouse was in the open field experiment (temporal bins = 2059).

