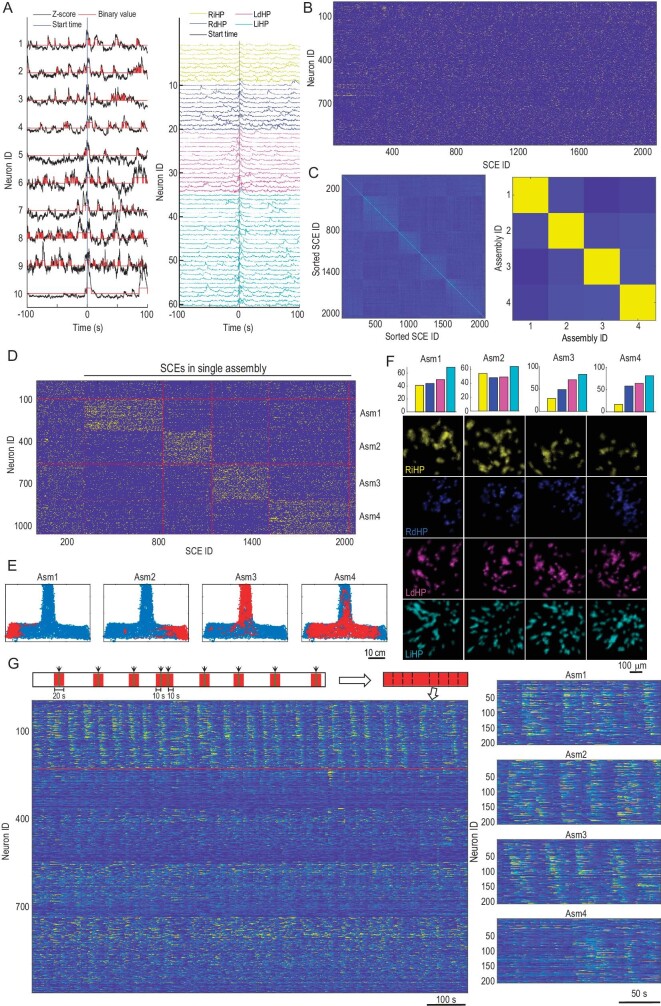
Figure 5.
Neuronal assemblies during the T-maze task. (A) Detection of SCEs from extracted calcium traces. Left: activities of the example neurons were z-scored and thresholded at 1 standard deviation (SD); right, neuronal activity of all neurons participating in an SCE. The vertical lines indicate the onset of an SCE. (B) Raster plot of neuronal participation in all SCEs. (C) Correlation maps of the detected SCEs (left) and the identified neuronal assemblies (right). The SCE IDs were ordered by the associated assemblies of the participating neurons in each SCE. (D) Same as (B) but the neuron IDs and SCE IDs were ordered to match the found assemblies. The SCEs to the left column were not involved in any assembly, while the SCEs to the right column were involved in multiple assemblies. (E) The mouse's position when SCEs associated with a specific assembly occurred. (F) The number of neurons in each region (color coded as labels below) and their spatial footprints in different assemblies. (G) Neurons associated with each assembly showed repeated activation sequences. Left is the concatenated calcium traces, as illustrated in the top diagram. Only time intervals within ± 10 second windows of all SCEs associated with an example assembly (assembly 3, including neurons above the red line) will be preserved. Neurons were grouped by their associations with different assemblies. Within each assembly, neuron IDs were sorted according to their peak intensity time. Right, repeated activation sequences of neurons associated with each assembly.

