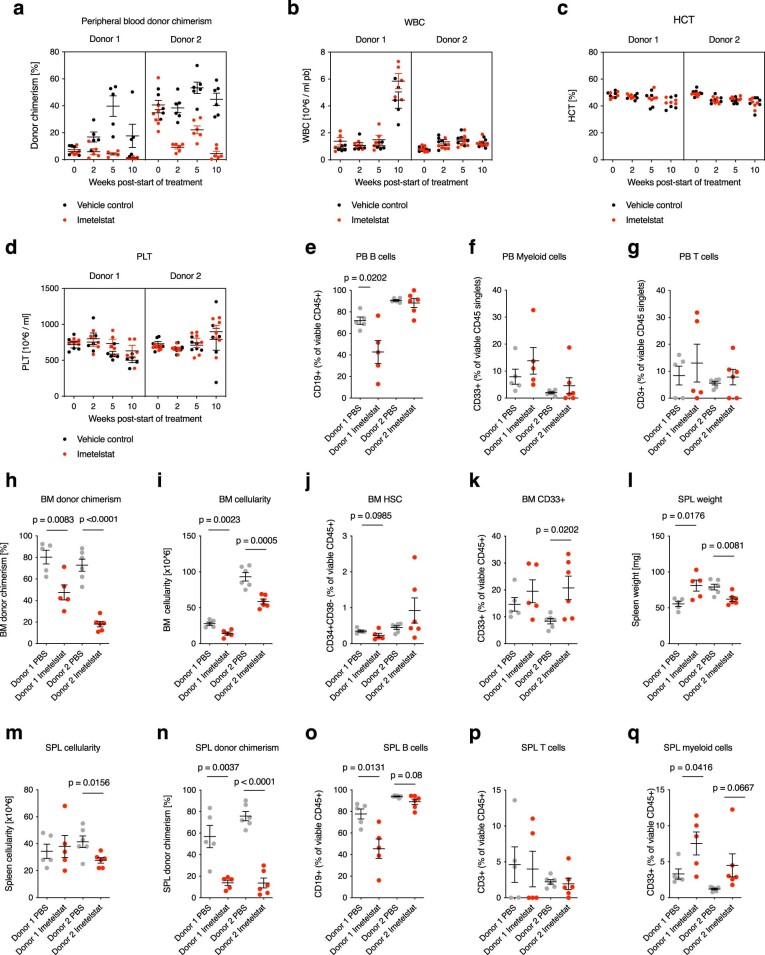
Extended Data Fig. 2. The effect of imetelstat on normal hematopoiesis.
Humanized in vivo models of hematopoiesis were generated by transplanting viable CD34+ mononuclear cells isolated from cord blood samples from two independent donors into NSG recipients (donor 1: 56,000 cells per NSG, n = 5 NSG per treatment group; donor 2: 212,500 cells per NSG, n = 6 NSG per treatment group). Recipients were treated for 10 weeks with imetelstat (15 mg/kg body weight) or vehicle control three times per week starting one month after transplantation. a-d, Peripheral blood time course analysis of donor chimerism (a), white blood cell counts (WBC; b), hematocrit (HCT, c), and platelet levels (PLT; d). e-g, Flow cytometry analysis of peripheral blood for B cell surface marker expression (CD19; e), myeloid surface marker expression (CD33; f), and T cell surface marker expression (CD3; g) at 10 weeks post-start of treatment. h-k, Bone marrow analysis of cord blood recipients at 10 weeks post-start of treatment: donor chimerism (h), cellularity (i), hematopoietic stem cell population percentage (CD34+CD38- %; j), and myeloid population percentage (CD33+; k). l-q, Analysis of cord blood recipient’s spleens at 10 weeks post-start of treatment: spleen weight (l), cellularity (m), donor chimerism (n), B cell population (CD19+ %; o), T cell population (CD3+ %; p), and myeloid cell population (CD33+ %; q). a-q, Data are presented as mean±SEM. e-q, Statistics based on unpaired two-sided t-test comparing imetelstat with PBS-treated groups within each donor: P = 2.02 × 10⁻² (donor 1; e), P = 8.3 × 10⁻³ (donor 1; h), P < 1 × 10⁻³ (donor 2; h), P = 2.3 × 10⁻³ (donor 1; i), P = 5 × 10⁻⁴ (donor 2; i), P = 9 × 10⁻² (donor 1; j), P = 2.02 × 10⁻² (donor 2; k), P = 1.76 × 10⁻² (donor 1; l), P = 8.1 × 10⁻³ (donor 2; l), P = 1.56 × 10⁻² (donor 2; m), P = 3.7 × 10⁻³ (donor 1; n), P < 1 × 10⁻⁴ (donor 2; n), P = 1.31 × 10⁻² (donor 1; o), P = 8 × 10⁻² (donor 2; o), P = 4.16 × 10⁻² (donor 1; q), P = 6.67 × 10⁻² (donor 2; q).

