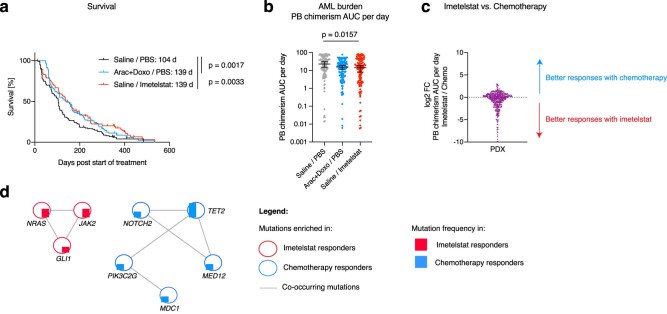
Extended Data Fig. 3. Comparative analysis of AML PDX responses to imetelstat versus standard induction chemotherapy.
a, Median survival was 104 (vehicle control (Saline / PBS) – treated PDX; black; n = 120 PDX) versus 139 (chemotherapy-treated PDX; Arac+Doxo; blue; P = 1.7 × 10⁻³; n = 120 PDX) and 139 (imetelstat-treated PDX; Saline / Imetelstat; red; P = 3.3 × 10⁻³; n = 120 PDX) according to Gehan–Breslow-Wilcoxon (two-sided Kaplan–Meier analysis). b, AML burden quantified as peripheral blood donor chimerism per day. Statistics based on ordinary One-way-ANOVA adjusted for multiple comparisons. N = 120 PDX per treatment group. P = 1.57 × 10⁻² (vehicle versus imetelstat). c, Imetelstat versus chemotherapy response calculation as log2FC of peripheral blood chimerism area under the curve per day in AML PDX. The red arrow indicates samples defined as preferential imetelstat responders, and conversely, the blue arrow indicates PDX defined as preferential chemotherapy responders. d, Cytoscape visualization of genes with mutations identified exclusively in preferential imetelstat responders (red) or chemotherapy responders (blue) at baseline.

