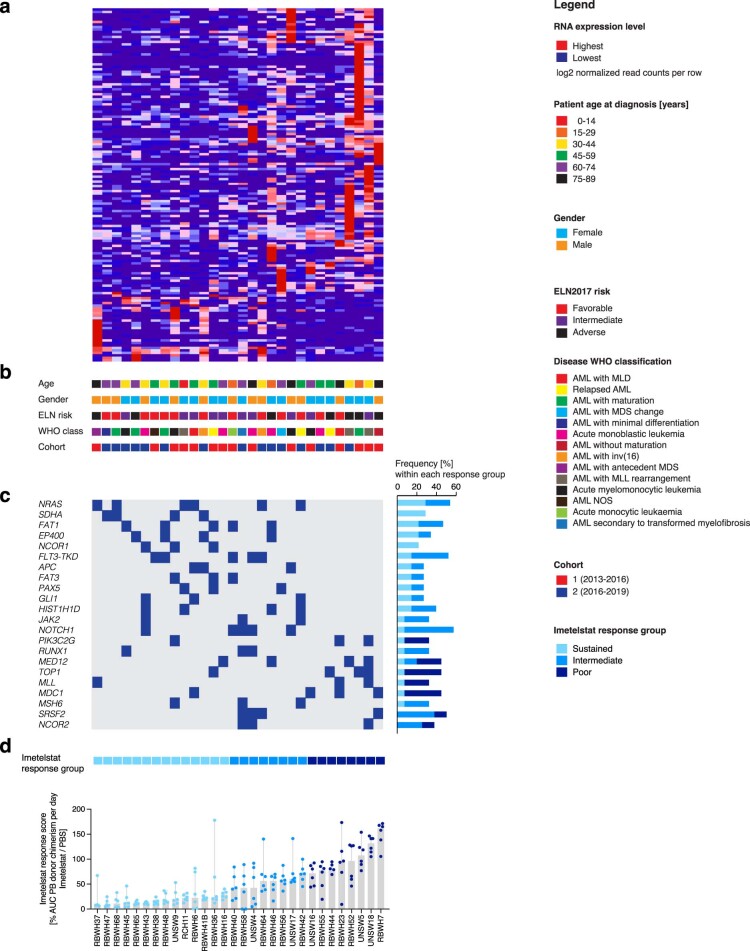
Extended Data Fig. 9. The molecular landscapes underlying imetelstat responses in AML PDX.
a, Unsupervised hierarchical clustering analysis on the expression of differentially expressed transcripts in sustained versus poor responders to imetelstat determined using glmFit function (R) with a cutoff of adjusted P value < 0.25 among 30 individual AMLs from our PDX repository. b, Key clinical characteristics of patients from whom AML samples were derived including age at diagnosis, gender, ELN2017 prognostic risk group, and WHO class of disease. c, OncoPrint of differentially detected mutations in AMLs from sutained versus poor responders to imetelstat at baseline by targeted next generation sequencing of 585 genes associated with hematologic malignancies (the MSKCC HemePACT assay)62. d, Imetelstat response classification: AML burden quantified as area under the curve of peripheral blood donor chimerism per day of imetelstat / vehicle (PBS)-treated AML PDX generated from each individual AML patient sample. N = 30 AML patient samples with n = 6 PDX per treatment group.

