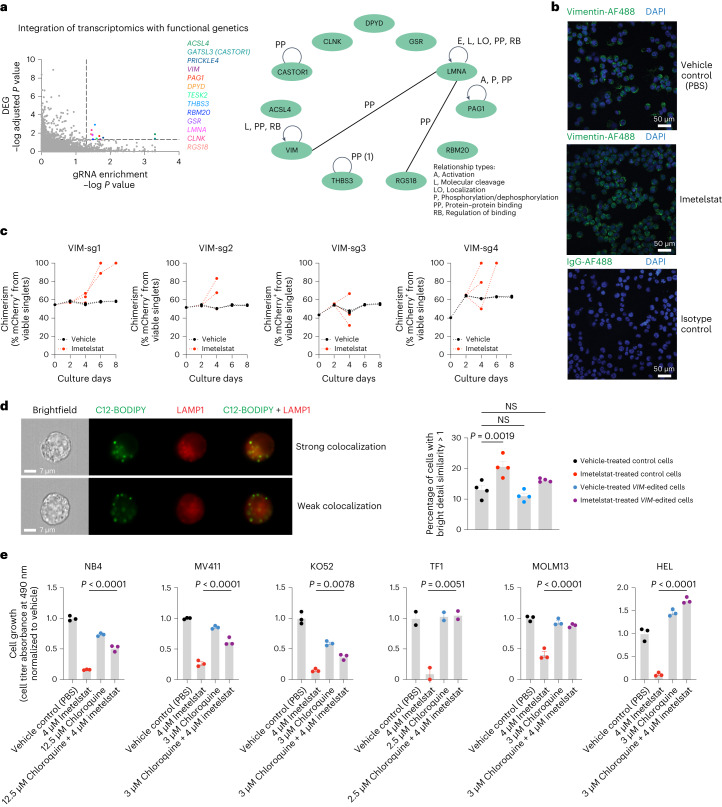
Fig. 6. Integrative analysis of transcriptomics and functional genetics.
a, Integration of RNA-seq and CRISPR screen data using relaxed cutoffs (differential gene expression analysis-derived adjusted P < 0.05 and gRNA enrichment analysis-derived RIGER P < 0.05). Thirteen genes (colored dots) passed these cutoff criteria, of which 11 were annotated in ingenuity pathway analysis (IPA) (right). A common regulatory module for VIM, LMNA and RGS18 is highlighted through connecting lines. DEG, differentially expressed gene. b, Confocal microscopy of VIM protein in NB4 cells treated with vehicle control (PBS) or imetelstat for 24 h. Representative images of n = 6 biological replicates. DAPI, 4,6-diamidino-2-phenylindole. c, VIM-editing in NB4 using n = 4 independent sgRNAs. Competition assays of mCherry+ VIM-edited cells grown in the presence of mCherry-unedited control NB4 cells, treated with imetelstat (red) or vehicle (PBS) control (black). Plots show data from one representative experiment. Two independent repeats were performed. d, Imaging flow cytometry of lipophagy using C12-BODIPY and LAMP1 in n = 4 independent VIM-edited (VIM-sg1, VIM-sg2, VIM-sg3 and VIM-sg4) or n = 4 independent editing-control (native, Cas9, empty vector or CD33-sg2) NB4 cell lines. Recovery examples of cells showing strong colocalization of C12-BODIPY and LAMP1 indicative of lipophagy activity (top) or cells with weak colocalization indicating insignificant lipophagic flux. Quantification of the percentages of cells with strong colocalization defined as bright detail similarity score >1. Data are presented as mean ± s.e.m. Statistics are based on a one-way ANOVA adjusted for multiple comparisons to PBS-treated editing controls. Editing controls + PBS versus editing controls + imetelstat, P = 1.9 × 10⁻³; editing controls + PBS versus VIM-edited + PBS, P = 4.955 × 10⁻¹; editing controls + PBS versus VIM-edited + imetelstat, P = 2.128 × 10⁻¹. Comparisons were considered NS when P > 5 × 10⁻². Data are from one experiment representative of four independent experiments. This experiment was repeated three times with similar results. e, Chloroquine and imetelstat combination treatments in AML cell lines. Data are presented as mean ± s.e.m. One-way ANOVA was used and adjusted for multiple comparisons. NB4 (n = 3 replicates), P < 1 × 10⁻⁴; MV411 (n = 3 replicates), P < 1 × 10⁻⁴; KO52 (n = 3 replicates), P = 8 × 10⁻³; TF1 (n = 2 replicates), P = 5.1 × 10⁻³; MOLM13 (n = 3 replicates), P < 1 × 10⁻⁴; HEL (n = 3 replicates), P < 1 × 10⁻⁴. Each experiment was repeated once with similar results.

