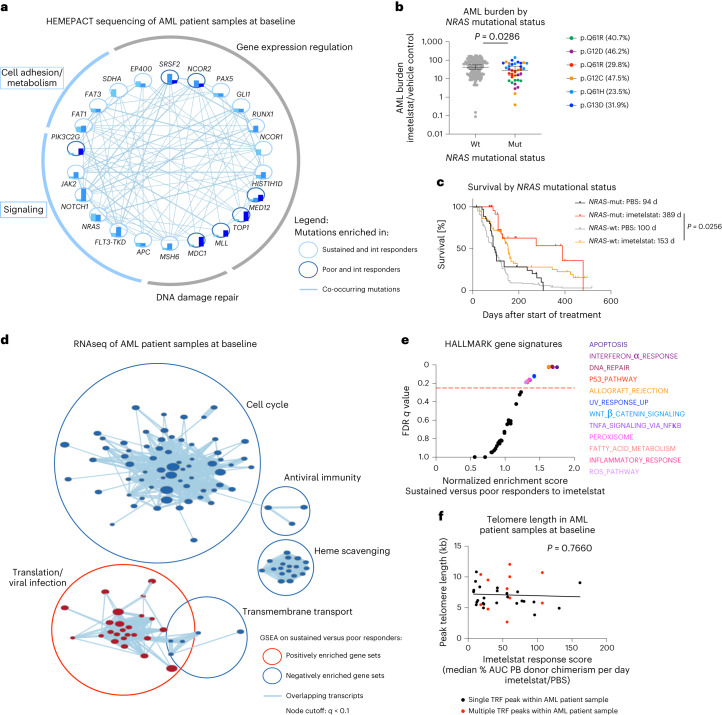
Fig. 7. Mutant NRAS and oxidative stress gene expression signatures associate with sustained responses to imetelstat.
Segregation of samples from patients with AML into sustained, intermediate and poor imetelstat response groups based on PB AML burden with n = 14 (sustained), n = 8 (intermediate) and n = 8 (poor). a, Cytoscape visualization of the frequencies of genes with oncogenic mutations (based on the COSMIC database79) in sustained (turquoise), intermediate (light blue) and poor (dark blue) responders to imetelstat. Connecting lines represent co-occurring mutations within the same AML patient sample. b, AML burden in imetelstat-treated normalized to vehicle control-treated PDXs in relation to NRAS mutational status. NRAS wild-type (wt; n = 144 PDXs) and mutant NRAS (mut; n = 36 PDXs). Statistics were conducted according to a two-sided t-test on log-transformed data: P = 2.86 × 10⁻². c, Two-tailed survival analysis of PBS and imetelstat-treated AML PDXs divided into groups based on their NRAS mutation status. Median survival was 94 (PBS-treated NRAS-mut; n = 36 PDXs), 389 (imetelstat-treated NRAS-mut; n = 36 PDXs), 100 (PBS-treated NRAS-wt; n = 144) and 153 (imetelstat-treated NRAS-wt; n = 144) days from start of treatment. P = 2.56 × 10⁻² comparing imetelstat-treated NRAS-mut to imetelstat-treated NRAS-wt PDX according to Gehan–Breslow–Wilcoxon. d, Cytoscape visualization of GSEA results on RNA-seq data from individual AML patient samples at baseline comparing sustained with poor responders to imetelstat (n = 14 sustained responders; n = 8 poor responders; node cutoff, q < 0.1). Red circles represent gene sets positively enriched in sustained versus poor responders to imetelstat. Blue circles represent negatively enriched gene sets in sustained versus poor responders to imetelstat. e, Hallmark GSEA on RNA-seq data comparing sustained versus poor responders to imetelstat at baseline. The red dotted line represents the cutoff considered for significant enrichment at FDR = 0.25. f, Simple linear regression analysis of baseline telomere length versus imetelstat response in PDXs. n = 30 AML patient samples. P = 7.66 × 10⁻¹; F = 8.998 × 10⁻¹; degrees of freedom numerator, degrees of freedom denominator = 1, 34; slope 95% CI (−2.219 × 10⁻¹, 1.648 × 10⁻¹); y intercept 95% CI (6.023, 8.449); x intercept 95% CI (367.9, +infinity). R2 = 2.639 × 10⁻³.

