Figure 1.
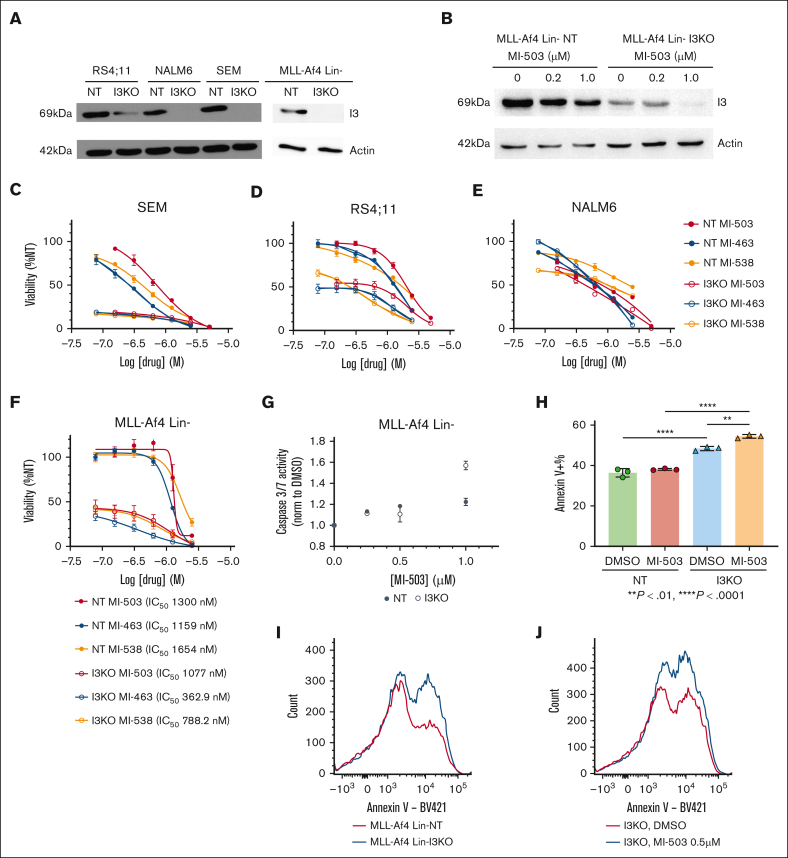
IGF2BP3 knockdown increases sensitivity of MLL-r leukemia cells to menin-MLL inhibition. (A) Western blot analysis showing IGF2BP3 knockdown in RS4;11, NALM6, and SEM cell lines and MLL-Af4 Lin– cells (using I3KO sgRNA targeting human and mouse genes and NT guide). (B) Western blot analysis showing IGF2BP3 expression in MI-503 treated MLL-Af4 Lin– cells depleted (I3KO) or nondepleted for IGF2BP3 (NT). Cells were treated with MI-503 (0.2 μM, 1.0 μM, or DMSO control) for 4 days. (C-E) Dose-response curves from cell viability assays, using CellTiterGlo, of human B-ALL cell lines, SEM, RS4;11, and NALM6, depleted (I3KO) vs nondepleted (NT) for IGF2BP3 treated with menin-MLL inhibitors (MI-503, MI-463, and MI-538) for 4 days. Viability has been normalized to DMSO control-treated cells not depleted for IGF2BP3 (NT DMSO); mean ± standard deviation (SD); n = 6. (F) Dose-response curves from cell viability assays, using CellTiterGlo, of MLL-Af4 Lin– cells depleted for IGF2BP3 (I3KO) vs nondepleted (NT) treated with menin-MLL inhibitors for 4 days. Viability has been normalized to DMSO control-treated cells not depleted for IGF2BP3 (NT DMSO); mean ± SD; n = 6. (G) Increased caspase 3/7 activity of MI-503 treated MLL-Af4 Lin– cells depleted for IGF2BP3 (I3KO) vs nondepleted (NT). Cells treated with MI-503 for 4 days at various concentrations for dose response. Caspase 3/7 activity measured using Caspase-Glo 3/7 and normalized to the activity of DMSO-treated control; mean ± SD, n = 3. (H) Increased annexin V positivity in MLL-Af4 Lin– I3KO cells (vs NT) and with MI-503 treatment (vs DMSO control); mean ± SD; n = 3 (1-way analysis of variance [ANOVA] with Bonferroni multiple comparisons test; ∗∗P < .01; ∗∗∗∗P < .0001). (I-J) Histograms from representative samples for annexin V staining, analyzed by flow cytometry. kDa, kilodalton.

