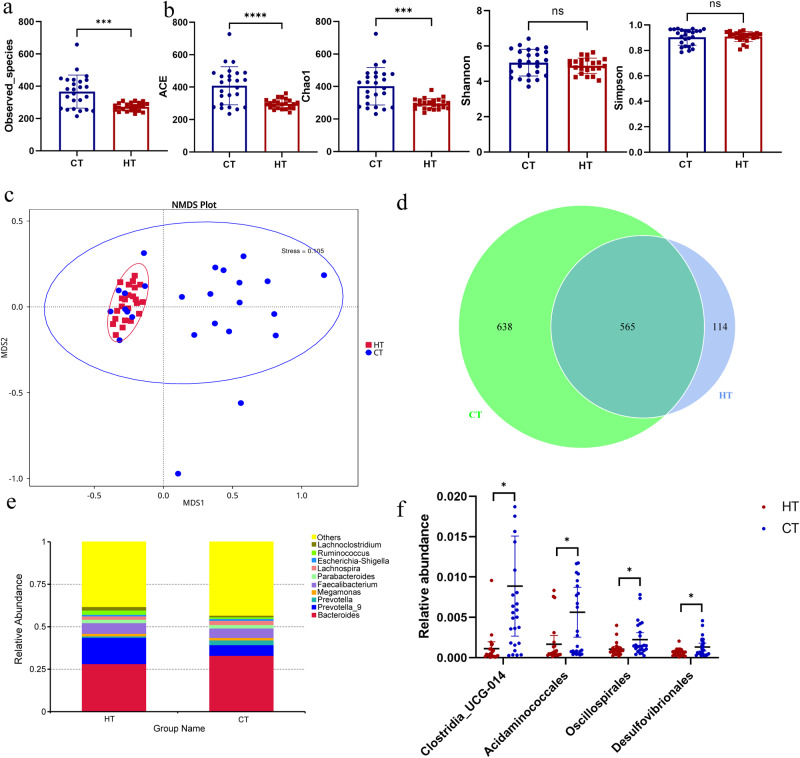
Fig. 1. Significant changes in the gut microbiota between patients with HT and healthy controls.
a Observed species between healthy control (CT) and patients with HT (HT). b The α diversity indices (Chao 1, ACE, Shannon, and Simpson indexes) of the microbiota in healthy control (CT) and patients with HT (HT). c Non-metric multidimensional scaling (NMDS) plot based on Bray–Curtis distance matrix of control and HT groups. d The Venn diagram illustrates the overlap of OTUs in gut microbiota among the two groups. Overlapping parts in the figure indicate common species. e Genus level comparison of fecal microbiota between the HT and healthy groups. f Comparison of the bacteria abundance at the order level in patients with HT and healthy controls using t test. N = 23 and 25 for HT and healthy control groups respectively.

