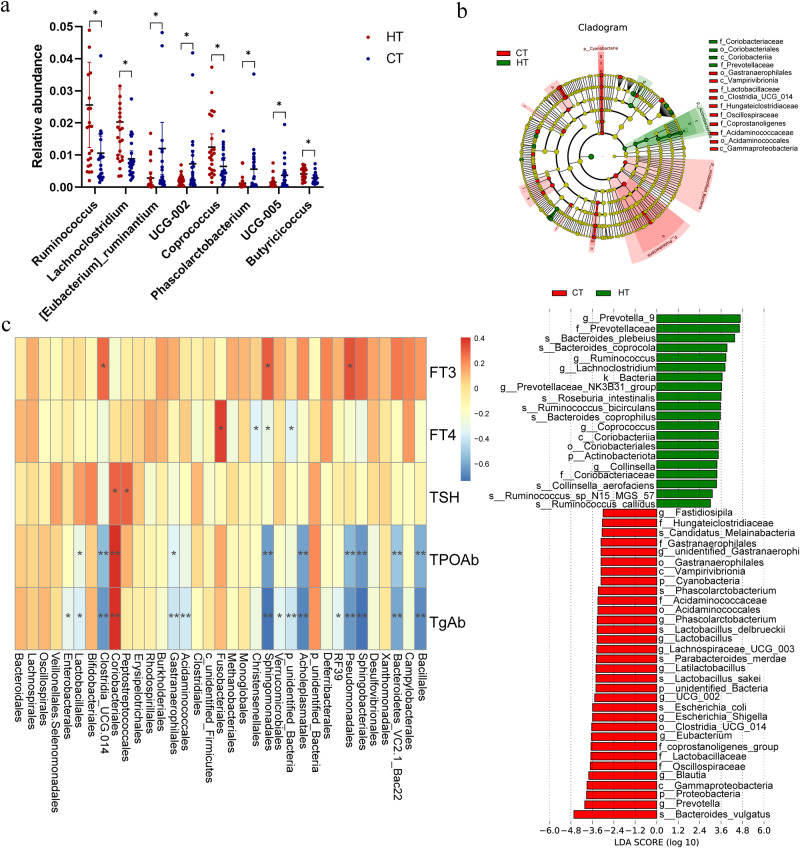
Fig. 2. Alterations of the gut microbiota in patients with HT compared to healthy controls.
a Comparison of the bacteria abundance at the genus level in patients with HT and healthy controls by t test. b Cladogram generated using LEfSe analysis. Red: increased abundance in the control group. Green: increased abundance in the HT group. LDA scores of the microbiota in HT and control groups at different taxonomic levels using LEfSe analysis. LDA score >3 or <3 represents bacteria taxa that are significantly enriched in the HT group (green) or control group (red) (P < 0.05). c Heatmap of correlations between thyroid clinical indicators of HT and the abundances of gut microbiota.

