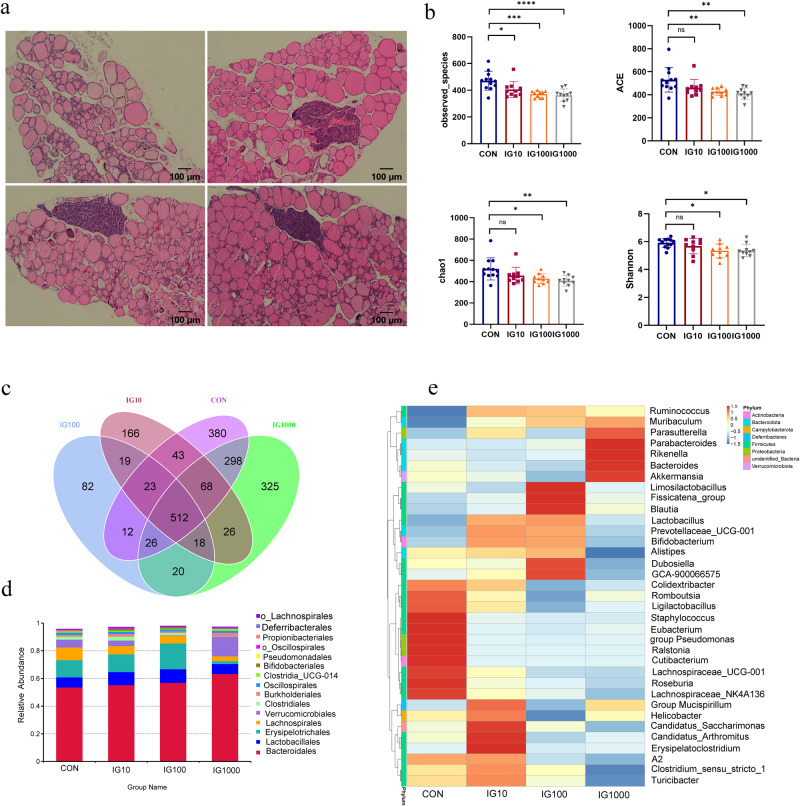
Fig. 4. Different iodine intake changed the composition of gut microbiota in HT mice.
a Thyroid inflammation was determined according to the lymphocyte infiltration area using HE staining of the mice’s thyroid gland. Scale bar: 100 μm. b The α diversity indices (Chao 1, ACE, Shannon, and Simpson indexes) of the microbiota among different iodine intake groups. c The Venn diagram illustrates the overlap of OTUs in gut microbiota among different iodine intake groups. Overlapping parts in the figure indicate common species. d Order level comparison of fecal microbiota among these four groups. e Heatmap based on the abundance of the first 35 genera among these four groups. N = 12, 10, 10, 10 for CON, IG10, IG100, and IG1000 groups respectively.

