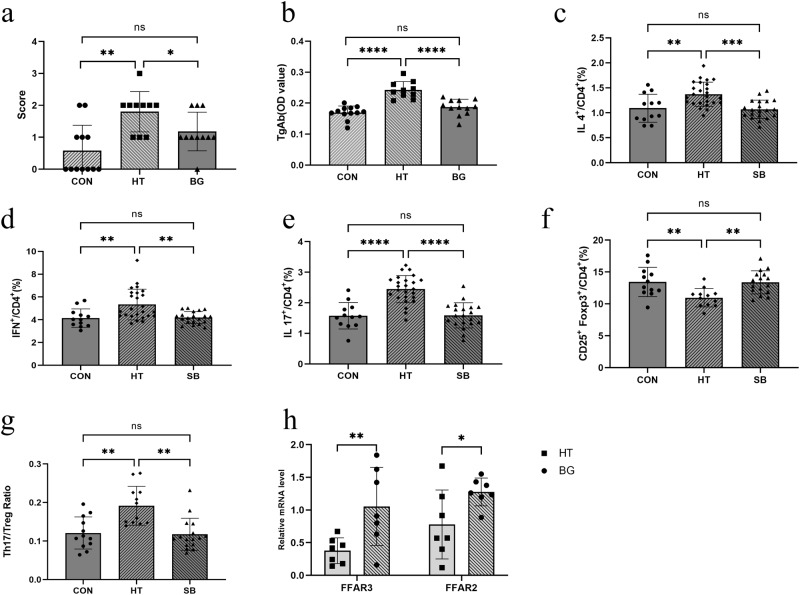
Fig. 6. Butyrate acid modulates the Th17/Treg imbalance in the spleen of mice assessed using flow cytometry.
a The scoring of lymphocyte infiltration of thyroid gland serum. b TgAb concentrations were determined using ELISA. c The percentage of CD4 + IL4 + T cells (Th2) among these three groups analyzed using flow cytometry. d The percentage of CD4 + IFN+cells (Th1) among these three groups analyzed using flow cytometry. e The percentage of CD4 + IL17+ cells (Th17) among these three groups analyzed using flow cytometry. (N = 12, 25, 20 for CON, HT, and BG group respectively). f The percentage of CD4 + CD25 + FOXP3+ cells (Treg) among these three groups analyzed using flow cytometry. g The ratio of TH17/Treg (CD4 + IL17 + / CD4 + CD25 + FOXP3+ cells) significantly decreased in the butyrate group compared with the HT group. h The mRNA expression of FFAR3 and FFAR2 in mice colon tissue. N = 7 in each group. The Kruskal-Wallis test was used to detect significant changes for (a, d), and One-way ANOVA was used for (b), (c), (e), (f). The Welch’s ANOVA test was used for (g). *P < 0.05, **P < 0.01, ***P < 0.001, and ****P < 0.0001, ns, no significance.

