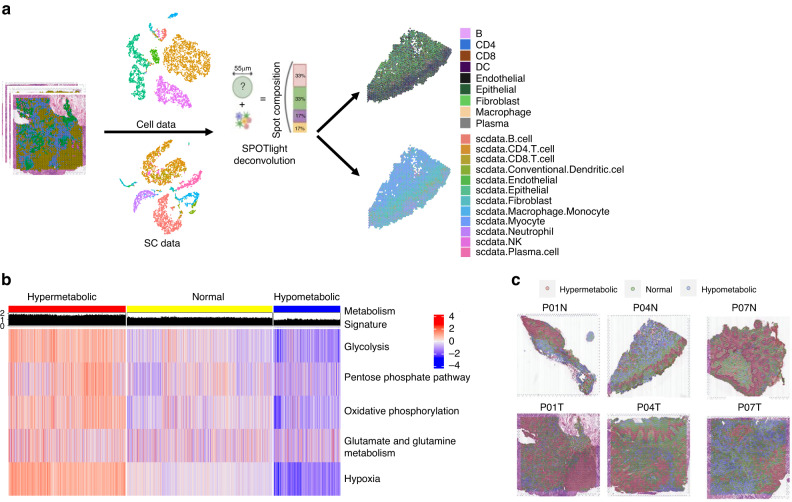
Fig. 2.
Metabolic heterogeneity of the oral squamous cell carcinoma tissue samples. a The SPOTlight deconvolution method was used to calculate the proportion of various cell types in each spot, using Cell data and SC data as reference. b Heatmap shows the metabolic score representing glycolysis, pentose phosphate pathway, oxidative phosphorylation, glutamate/glutamine metabolism, and hypoxia for each spot. All spots were categorized into three clusters based on their metabolic activity: hypermetabolic, normal-metabolic, and hypometabolic. c Representative spatial transcriptomic tissue slides show the spatially projected metabolism clusters

