Fig. 3.
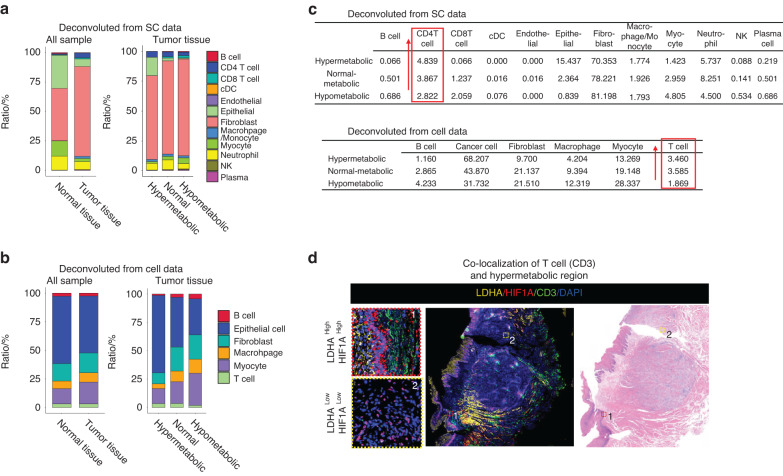
Metabolic heterogeneity affects the TME. a Deconvolution results from Cell data indicate the proportion of each cell type in different types of tissue and metabolic regions of tumors. b Deconvolution results from SC data indicate the proportion of representative cell type of each spot in different types of tissue and metabolic regions of tumors. c The detailed percentage of different cell types in Cell data and SC data is shown, with T cells and CD4T cells displaying a similar changing trend in different metabolic regions. d Immunofluorescence shows the co-localization of T cells (CD3) and hypermetabolic regions (LDHA and HIF1α) in OSCC

