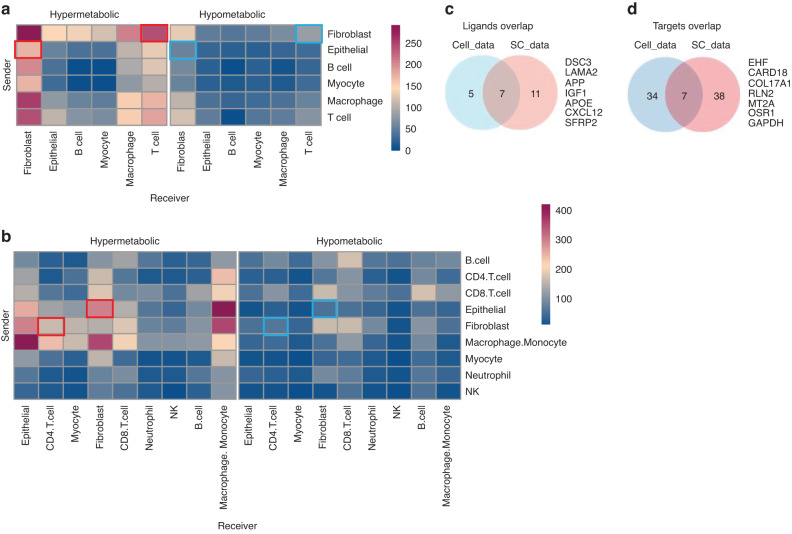
Fig. 4.
Cell communications in different metabolic regions of tumor tissues. Heatmap showing the counts of cell-cell communication between different cell types in the three metabolic regions. a Cell data deconvolution and b SC data deconvolution. The red and blue boxes indicate the communication between fibroblast-T (CD4 T) and Epithelial-fibroblast in hypermetabolic and hypometabolic regions, respectively. The blue box indicates changes in the communication of fibroblasts. c Intersection of predicted ligands from Cell data and SC data through Nichenet analysis. d Intersection of predicted target genes for the predicted ligands from Cell data and SC data through Nichenet analysis. The 7 target genes were used as the target panel below

