Fig. 7.
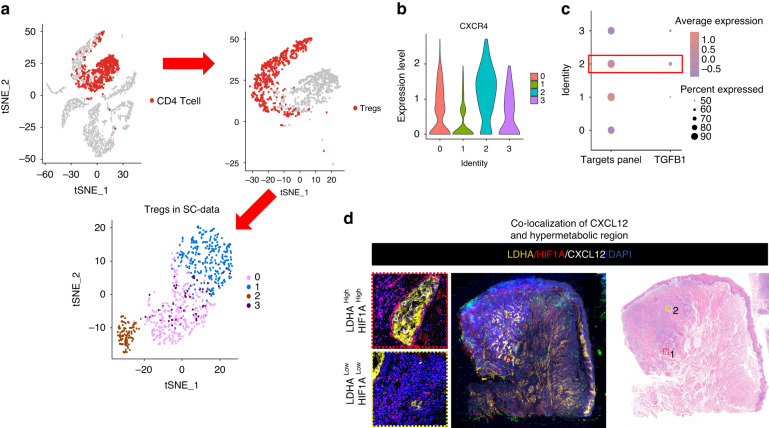
Heterogeneity of Tregs. a Tregs were isolated from CD4 cells in single-cell data and subjected to unsupervised clustering, resulting in four distinct groups. b A violin plot depicts the expression of CXCR4 in the four Tregs clusters. Cluster 2 exhibits the highest expression of CXCR4. c A dotplot illustrates the expression of the targets panel and TGFB1 in the four Tregs clusters. Cluster 2 displays the highest expression of both. d Immunofluorescence staining shows the co-localization of CXCL12 and hypermetabolic regions (LDHA and HIF1α) in OSCC

