Fig. 8.
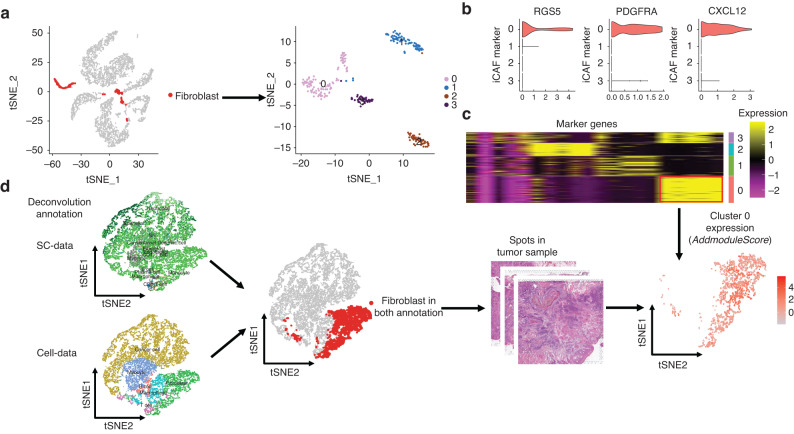
Secretion of CXCL12 is mainly from iCAF. a Fibroblasts were extracted from SC data and clustered into four groups using unsupervised clustering. b Violin plot showing the expression of RGS5, PDGFRA, and CXCL12 in the four fibroblast clusters. Cluster 0 exhibited the highest expression of all three markers. c Heatmap displaying the expression of specific marker genes for the four fibroblast clusters. The marker genes of Cluster 0 were chosen for further analysis. d Analysis of spots that were identified as fibroblasts in both the SC data and spatial transcriptomics (ST) data. The marker genes of Cluster 0 were mapped onto these spots

