Fig. 9.
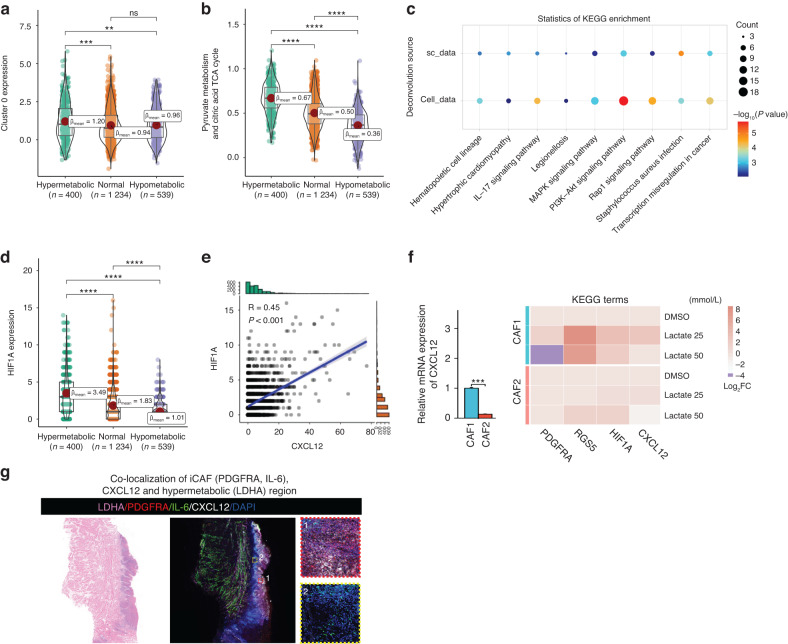
Lactate promotes the transition of fibroblasts to iCAF. a Violin plot showing the expression of Cluster 0 in different metabolic regions in the ST data. Expression in hypermetabolic regions was higher than that in hypometabolic regions. b Metabolic activity scores of pyruvate metabolism and citric acid cycle in fibroblasts in different metabolic regions. Pyruvate metabolic activity increased gradually with increasing metabolic activity. c Top 10 KEGG functional pathways of predicted target genes of fibroblasts through Nichenet analysis. d HIF1A expression in tumor-infiltrating fibroblast spots in different metabolic regions. HIF1A expression was higher in hypermetabolic regions. e Correlation scatter plot of HIF1A expression and CXCL12 expression in tumor-infiltrating fibroblast spots. f RT-qPCR analysis of iCAF markers (PDGFRA, RGS5), HIF1A, and CXCL12 expression in 2 CAF cell lines after 72 h of treatment with lactate. g Immunofluorescence staining shows the co-localization of iCAF (PDGFRA and IL-6), CXCL12 and hypermetabolic regions (LDHA) in OSCC

