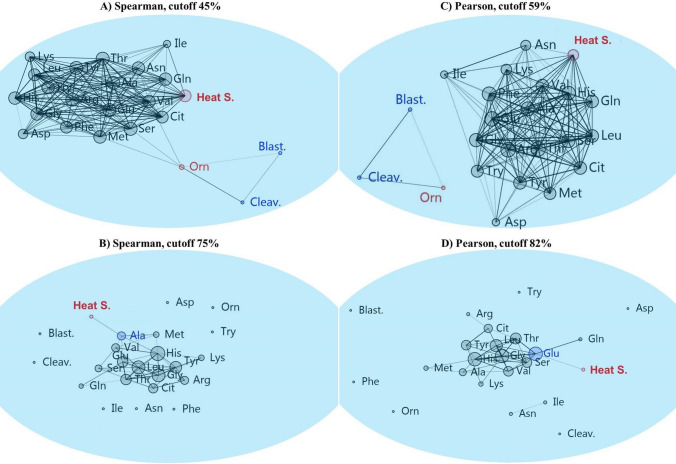
Fig. 8.
The Spearman’s rho (a, c) and Pearson (b, d) similarity indices were used in combination with the Fruchterman–Reingold algorithm as a force-directed layout algorithm in the network analysis. This method constructs a network based on the frequency with which nodes are linked. The panels show the most closely related amino acid/s metabolism in cumulus-oocyte complexes during in vitro maturation to (a, b) blastocyst rate and cleavage rate or (c, d) heat shock. Blast blastocyst rate, Cleav cleavage rate

