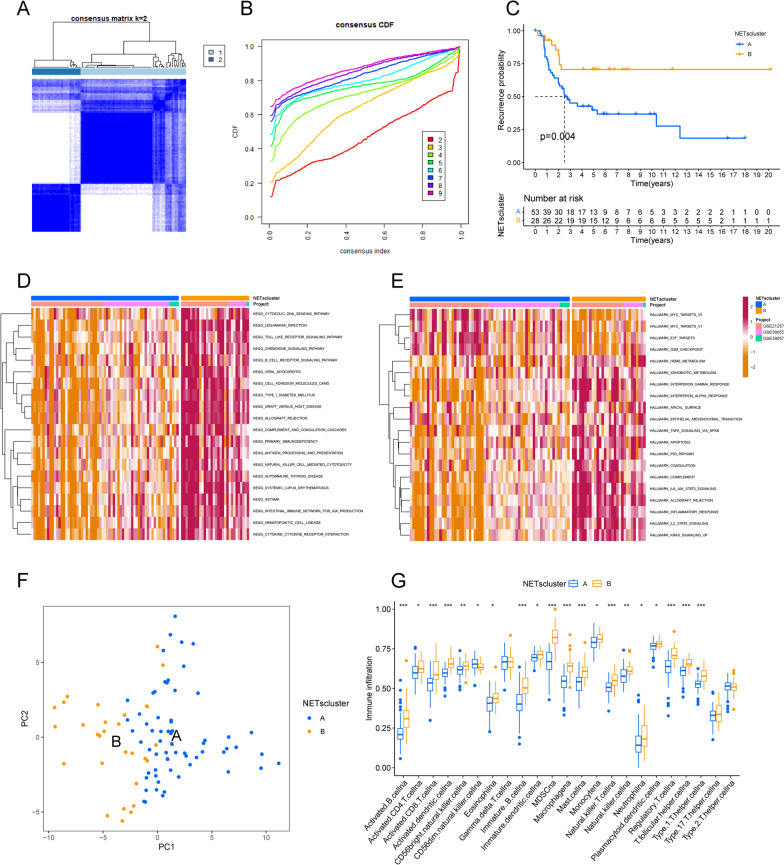
Fig. 2.
Identification of NETs cluster in OS. A and B show the consensus clustering matrix based on k = 2 of the metastasis-related NETs expressions, and C shows the Kaplan–Meier curves of the metastasis time in both NETs subtypes. D shows the GSVA scores of the KEGG pathway in both NETs subtypes. The red color indicates the activation pathway and the blue color indicates the inhibition pathway. E shows the GSVA scores of the Hallmark pathway in the two NETs subtypes. F shows the principal component analysis of the two NETs subtypes, showing the significant differences between the different subtypes. G shows the abundance of each infiltrating immune cell in the two NETs subtypes

