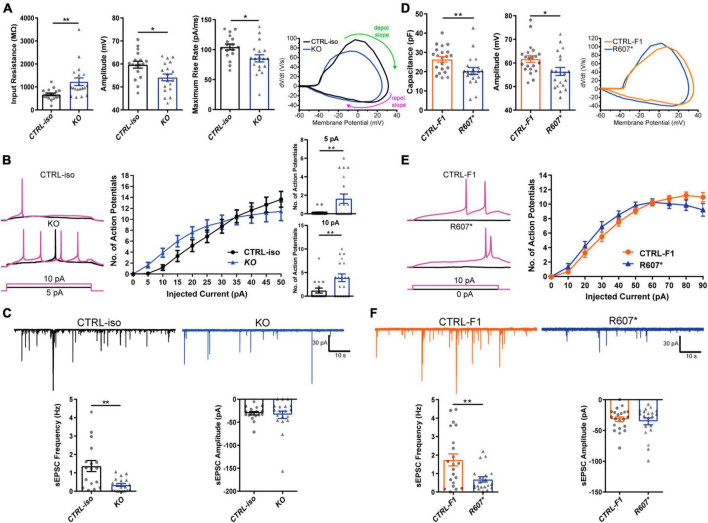
FIGURE 3.
Functional loss of SCN2A disrupts neuronal activity and synaptic transmission. (A) Membrane and action potential properties of CTRL-iso and SCN2A KO iNeurons (n = 17 and 19, respectively), 3 viral transductions. Left: bar graph of recorded input resistance [t(34) = 3.019, p = 0.0048]. Middle: bar graph of measured action potential amplitude [t(34) = 2.667, p = 0.0116]. Right: bar graph of the maximum rise rate [t(34) = 2,430, p = 0.0205] and the associated phase plane plot of action potential kinetics. Labeled on the phase plane plot are the depolarization (depol.) and repolarization (repol.) slopes in the green and purples arrows, respectively. Data represent means ± SEM. *p < 0.05, **p < 0.01, Student’s t-test. (B) Repetitive firing properties of SCN2A KO iNeurons. Data represent means ± SEM. *p < 0.05, **p < 0.01, two-way repeated measures ANOVA with post hoc Sidak correction [F(1, 39) = 0.0512, p = 0.8222 for effect of genotype; F(10, 390) = 3.075, p = 0.0009 for interaction of current injection and genotype, significant current injections are shown as bar plots]. (C) Synaptic transmission representative traces and analysis. Left: sEPSC frequency of synaptic transmission [t(34) = 3.520, p = 0.0013]. Right: sEPSC amplitude of synaptic transmission [t(34) = 0.3602, p = 0.7209]. CTRL-iso (n = 17) and KO (n = 19) iNeurons. Data represent means ± SEM. *p < 0.05, **p < 0.01, Student’s t-test. (D) Membrane and action potential properties of CTRL-F1 and R607* iNeurons (n = 21 and 20, respectively). Left: bar graph of recorded capacitance [t(39) = 2.626, p = 0.0123]. Middle: bar graph of measured action potential amplitude [t(39) = 2.435, p = 0.0195]. Right: phase plane plot of action potential kinetics. (E) Repetitive firing properties of CTRL-F1 and R607* iNeurons. CTRL-F1 (n = 21) and R607* (n = 20) iNeurons, 3 viral transductions. Data represent means ± SEM. *p < 0.05, two-way repeated measures ANOVA with post hoc Sidak correction [F(1, 34) = 0.2956, p = 0.5902 for effect of genotype; F(10, 340) = 2.525, p = 0.0061 for interaction of current injection and genotype]. (F) Synaptic transmission representative traces and analysis. Left: sEPSC frequency of synaptic transmission [t(39) = 2.930, p = 0.0056]. Right: sEPSC amplitude of synaptic transmission [t(39) = 0.5059, p = 0.6158]. CTRL-F1 (n = 21) and R607* (n = 20) iNeurons, 3 viral transductions. Data represent means ± SEM. *p < 0.05, **p < 0.01, Student’s t-test.

