FIGURE 4.
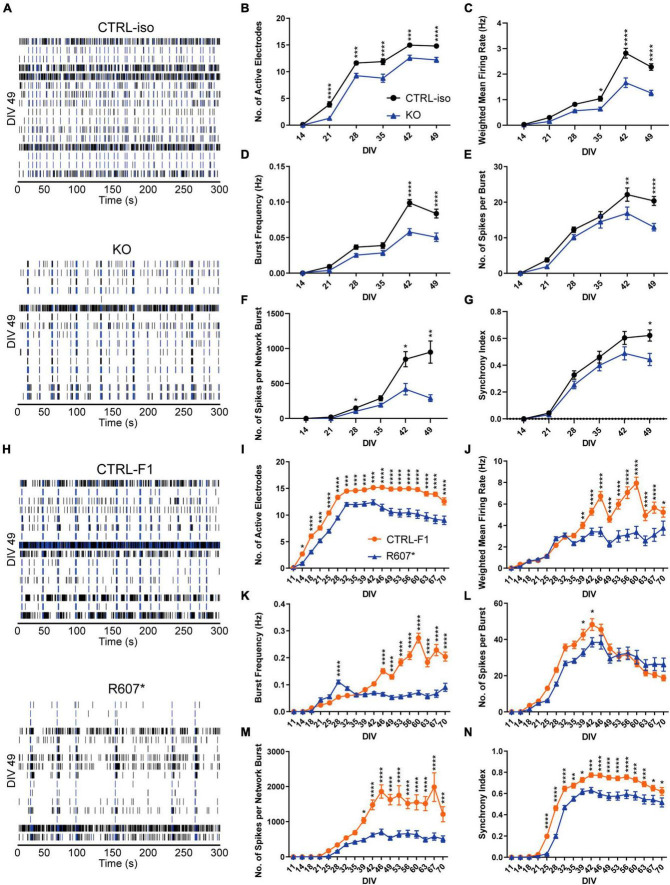
Complete and partial loss of SCN2A impairs the development of spontaneous network activity via multi-electrode array. (A) Example raster plots of recordings of neuronal network activity at DIV 49 for CTRL-iso and SCN2A KO iNeurons. (B–G) Quantification of MEA parameters for CTRL-iso and KO iNeurons: (B) number of active electrodes [F(1, 83) = 35.55, p < 0.0001 for effect of genotype; F(5, 415) = 4.778, p = 0.0003 for interaction of time and genotype], (C) weighted mean firing rate [F(1, 83) = 37.31, p < 0.0001 for effect of genotype; F(5, 415) = 14.32, p < 0.0001 for interaction of time and genotype], (D) burst frequency [F(1, 83) = 27.78, p < 0.0001 for effect of genotype; F(5, 415) = 12.68, p < 0.0001 for interaction of time and genotype], (E) number of spikes per burst [F(1, 83) = 6.570, p = 0.0122 for effect of genotype; F(5, 415) = 5.011, p = 0.0002 for interaction of time and genotype], (F) number of spikes per network burst [F(1, 83) = 14.55, p = 0.0003 for effect of genotype; F(5, 415) = 11.85, p < 0.0001 for interaction of time and genotype], (G) synchrony index [F(1, 83) = 3.667, p = 0.0586 for effect of genotype; F(5, 415) = 4.170, p = 0.0010 for interaction of time and genotype]. CTRL-iso (n = 47 wells) and KO (n = 43 wells) iNeurons, 3 viral transductions. Data represent means ± SEM. *p < 0.05, **p < 0.01, ***p < 0.001, ****p < 0.001, two-way repeated measures ANOVA with post hoc Sidak correction. (H) Example raster plots of recordings of neuronal network activity at DIV 49 for CTRL-F1 and R607* iNeurons. (I–N) Quantification of MEA parameters for CTRL-F1 and R607* neurons: (I) number of active electrodes [F(2, 62) = 24.71, p < 0.0001 for effect of genotype; F(34, 1,054) = 18.50 = 4.778, p < 0.0001 for interaction of time and genotype], (J) weighted mean firing rate [F(1, 125) = 21.49, p < 0.0001 for effect of genotype; F(17, 2125) = 16.10, p < 0.0001 for interaction of time and genotype], (K) burst frequency [F(2, 62) = 8.794, p = 0.0004 for effect of genotype; F(34, 1,054) = 8.359, p < 0.0001 for interaction of time and genotype], (L) number of spikes per burst [F(2, 62) = 23.98, p < 0.0001 for effect of genotype; F(34, 1,054) = 17.17, p < 0.0001 for interaction of time and genotype], (M) number of spikes per network burst [F(2, 62) = 25.04, p < 0.0001 for effect of genotype; F(34, 1,054) = 15.83, p < 0.0001 for interaction of time and genotype], (N) synchrony index [F(2, 62) = 21.68, p < 0.0001 for effect of genotype; F(34, 1,054) = 18.94, p < 0.0001 for interaction of time and genotype]. CTRL-F1 (n = 48 wells) and R607* (n = 46 wells) iNeurons, 3 viral transductions. Data represent means ± SEM. *p < 0.05, **p < 0.01, ***p < 0.001, ****p < 0.001, two-way repeated measures ANOVA with post hoc Sidak correction.

