Abstract
A field study was designed to examine the effect of desert shrubs on the dynamics of free-living amoebae in arid soil. Soil samples from 0- to 50-cm depths were collected at 10-cm intervals in each of the four seasons. The vertical distributions of the four main morphological types of amoebae, grouped according to their mobility, and of small flagellate populations were measured under the canopies of Hammada scoparia and Atriplex halimus, shrubs belonging to the chloride-absorbing xerohalophytes. The result obtained from the field study demonstrated that the total number of protozoa was significantly higher during the wet seasons (winter and spring) than during the dry seasons. The protozoan population was more diverse under the canopy of H. scoparia during the wet seasons, reaching 8,000 individuals per 1 g of dry soil, whereas during the dry seasons, the populations were higher under the canopy of A. halimus, with a mean of 250 individuals. The protozoan population in the deeper layers (40 to 50 cm) was found to be as active as that in the upper layers, demonstrating that, in the desert, soil columns below 20 cm are fertile and worth studying. The type 1 amoebae (e.g., Acanthamoeba and Filamoeba spp.) were the most abundant throughout the study period, and their numbers were significantly higher than those of the other amoeba types.
The organic fraction of the soil contains the organic molecules needed for microbial development, which makes microbes the most abundant group in the soil system (1). By grazing on the bacterial and fungal populations, micro- and mesofauna, such as protozoa and nematodes (8), maintain a dynamic biological equilibrium of terrestrial habitats. According to Sandon (22), studies in the early 19th century showed that the distribution of the protozoan population was limited to the upper 20 cm of the soil layer. Sandon's study (22) was based on 107 soil samples collected from different habitats around the world. His results showed that the protozoan population increases to a maximal level at a depth of 12.5 cm and decreases sharply at lower depths, with less than one individual per g of soil, represented by the naked amoeba Naegleria gruberi. For many years, soil protozoologists have been looking for protozoa only in the top 20 cm of the soil layer, and this has become a rule of thumb (25) that is followed in many studies of soil amoebae (3, 5, 6, 7, 27). Studies of soil protozoa in layers deeper than 20 cm were undertaken as a way to understand the consequences of organic contamination in groundwater reservoirs; these studies found high numbers (more than 8,000/g of soil) of flagellates, nanoflagellates (<10 μm), and naked amoebae (Gymnamoebae) at depths to 20 m (17). Ekelund et al. (13) recently found that the numbers and biomass of protozoa were highest on the surface layers (depth, 0 to 5 cm) of three pristine forest soils and that population levels were meager in the 15- to 50-cm-deep layers and nondetectable below 50 cm. That study confirmed Sandon's (22) long-established conclusion that “in a clay subsoil the protozoa are quite negligible and probably all of the few that do occur are encysted, especially [in] soils from temperate regions.”
Lack of water is one of the most limiting factors in arid and semiarid terrestrial ecosystems (18). During 90% of the year, soil in the desert is in an extreme condition of dryness that influences the organisms' activities and, therefore, also affects nutrient recycling by bacteria and protozoa. Water in the desert soil is in constant motion along vertical gradients. Thus, water dynamics in the surface layers might be very different than in the deeper ones.
Water infiltrates the soil during rainfall, moving through the soil to underground storage below the root zones of desert shrubs. It was found that, due to their ecophysiological adaptation, desert shrubs create “islands of fertility” (19, 24), where throughout the year, levels of moisture availability and biogeocycling are significantly higher than in bare, intershrub areas. The presence of roots, root exudates, and aboveground litter production (leafage, defoliation) makes a functional difference by affecting the soil matrix and microbial population activity, which results in increased productivity (8). The nonrhizosphere soil is found to be the poorest in numbers of microorganisms and, because of that, is also the least productive part of the soil.
Since microbial activity is mediated in the rhizosphere and is scattered horizontally in the soil profile, we assumed that the protozoon population would be found to be distributed spatially in this microhabitat and that the distribution would change according to its size and composition. The presence of aridoactive plants, such as Hammada scoparia and Atriplex halimus, both of which are chloride-absorbing xerohalophytes, is suggested to strongly influence microbial activity and protozoan population dynamics in this soil. In the present study, we focused our attention on naked amoebae and flagellates, since they are more numerous than ciliates in the soil matrix (15).
Our objective was to determine (i) the vertical distribution of the sizes and diversity of the four main morphological types of amoeba (Gymnamoebae) populations, grouped according to their mobility, and (ii) the population dynamics of flagellates throughout the 0- to 50-cm-deep soil layers under the rhizospheres of H. scoparia and A. halimus in the Negev Desert.
We hypothesized that, due to the harsh environmental conditions in the Negev Desert, population levels of amoebae and flagellates in the soil surrounding the shrub rhizosphere would increase toward the deeper layers and would be strongly affected by the ecophysiological adaptation of the desert halophytes. However, a significant decrease in population levels in the shrub interspace was observed.
MATERIALS AND METHODS
The study site was located at the M. Evenari Runoff Research Farm (34o46′E, 30o47′N), Avdat, in the Negev Desert, Israel. This site is approximately 600 m above sea level, with a multiannual average rainfall of 89.5 mm (at Avdat Station). The area consists of loessial, plain, rocky slopes with shallow, saline, gray, lithogenic, calcareous soils. The soil at the study site is an alkaline (pH 7.8), deep, fine-textured, loessial sierozem (9) with small amounts of organic carbon (OC) (0.47%) and large amounts of carbonate (40%). The climate is Mediterranean, with mild, rainy winters (5 to 14°C in January) and hot summers (18 to 32°C in June). The rainy season usually begins in October and ends in late April, with most of the rainfall occurring as scattered showers between December and February. An additional moisture source is dew deposition, which accounts for approximately 35 mm of rainfall per year and which occurs heavily during 210 nights annually, mainly in late summer and autumn. The annual evaporation rate is 2,615.3 mm per year (14).
Soil samples were taken at 10-cm intervals up to a depth of 50 cm, at depths of 0 to 10, 10 to 20, 20 to 30, 30 to 40, and 40 to 50 cm. The samples were collected randomly below four individual plants of H. scoparia and four individual plants of A. halimus. Control samples were taken from exposed interspace areas between shrubs at the same intervals and layers. The samples were placed in individual plastic bags and transported to the laboratory in a cooler in order to avoid subjecting them to heat during the hot summer periods. All soil samples were sieved (mesh size, 2 mm) to remove root particles and other organic debris. Sets of subsamples from each replicate were used to determine soil moisture, total organic matter, and soil amoeba and flagellate populations. The soil samples were taken in midseason in winter, spring, summer, and autumn 2001.
Soil analysis was performed on samples from depths of 0 to 10, 10 to 20, 20 to 30, 30 to 40, and 40 to 50 cm.
Soil moisture.
A 3-g subsample from each of four replicate samples from each site was weighed and dried at 105°C for 48 h for gravimetrical determination of its water content.
Soil OC.
Soil OC was determined by using the modified chromate combustion methods of Rowell (21) and Xie and Steinberger (31).
Protozoan population.
The most-probable-number method was used to determine amoeba and flagellate populations by the serial dilution method (2). Soil extract at a dilution of 1:5 (working solution) was used for the most-probable-number procedure. The soil extract was prepared by homogenizing 200 g of soil in 1,000 ml of tap water under continuous heating at 60°C for 2 h; then, the extract was filtered and autoclaved for 15 min (25). Twenty-four-well tissue culture plates were inoculated as follows. A soil-water mixture was prepared by homogenizing 1 g of soil in 10 ml of soil extract. Five 15-s pulses of vigorous shaking in a vortex achieved homogenization. The homogenate was left undisturbed for 15 min. Then, 10-fold serial dilutions were made, beginning with 10−2 and ending with 10−7. These dilutions were prepared by placing 100 μl of the soil mixture in the first row of a 24-well tissue culture plate, which was first filled with 900 μl of soil extract. Six dilutions were prepared, with four replicates for each dilution. The plates were incubated at 28°C for 7 to 10 days and reviewed with a phase-contrast, inverted microscope for the presence of amoebae and flagellates.
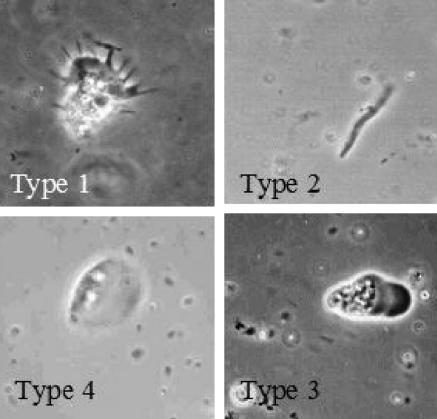
We used the four morphological types of classification proposed by Anderson and Rogerson in order to obtain qualitative information on diversity among the amoebae (5). Four amoeba types were identified using this classification (Fig. 1). Type 1 amoebae are those with extended pseudopodia or subpseudopodia (such as Acanthamoeba and Filamoeba spp.). Type 2 amoebae are limax amoebae with noneruptive, cylindrical, monopodial locomotion (such as Hartmannella and Saccamoeba spp.). Type 3 amoebae are limax amoebae with eruptive locomotion (such as Vahlkampfia and Naegleria spp.). Type 4 amoebae are fan-shaped, flattened amoebae (such as Vannella and Platyamoeba spp.).
FIG. 1.
Amoeba morphotypes. Magnification, ×40.
Data were normalized, and two-way analysis of variance was used for comparison between seasons and depths. Pearson's correlation and covariance tests were performed in order to examine the relationship between the water content and the number of amoebae and flagellates.
RESULTS
Soil moisture and OC.
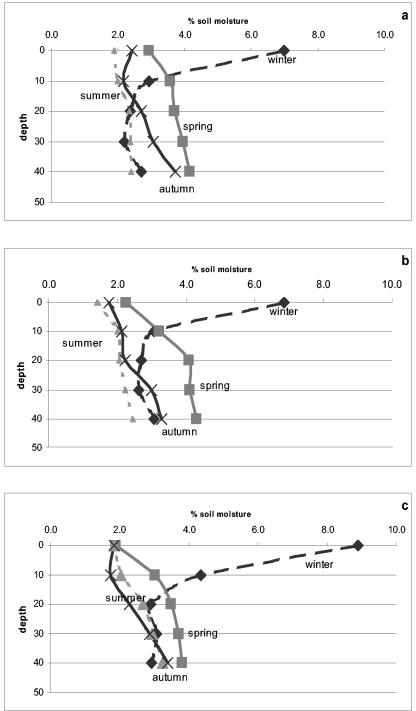
The soil moisture content was found to be significantly higher in winter, reaching maximal levels of 7, 6.9, and 8.9% under the A. halimus and H. scoparia plants and the control samples, respectively (Fig. 2). During winter, a significant difference (P < 0.001) was found between the layer at 0 to 10 cm and the other depths, with a 30% average decrease in moisture between the two groups. Toward springtime, the soil moisture content decreased to a mean of 3.6% under the plants, with no significant difference between the groups (P > 0.01). Between plants, at the open sites, the soil moisture was found to decrease to a level of 3.1%, which was significantly lower (P < 0.05) than the levels in the soil samples that were taken from under the plants. A similar pattern was found during the summer season, with soil moisture reaching a minimal level of 2.3%, with no significant differences between the samples. In autumn, an increase in soil water content to a level of 2.8% was measured under A. halimus, which was significantly higher (P > 0.01) than the values obtained under H. scoparia and the control sites (2.4%). Data analysis of the soil moisture availability during the study period exhibited similar patterns in the 0- to 10- and 40- to 50-cm-deep layers, where relatively higher soil moisture (3.3%) was found than in the interlayer (20 to 40 cm), which had a mean value of 2.8%.
FIG. 2.
Changes in soil moisture under the plant canopies of A. halimus (a) and H. scoparia (b) and in the control group (c) during the four seasons: winter, spring, summer, and autumn.
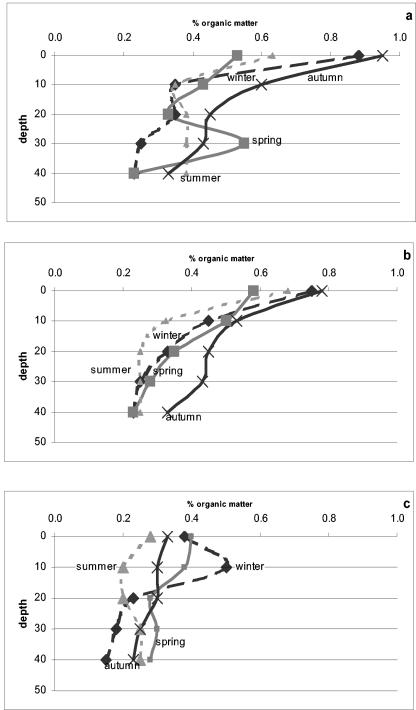
OC in the soil was found to be significantly (P < 0.001) affected by sampling site and depth (Fig. 3). A mean of 0.43% was measured under the plant canopies, whereas in the bare soil, the values were lower, reaching 0.3%. The OC level in the 0- to 10-cm-deep upper layer was significantly higher (P < 0.01) (0.6%) than in the deeper layers, where a gradual decrease to 0.3% was measured in the deepest (40- to 50-cm) layer (Fig. 3). The OC percentage was also affected (P < 0.01) by the sampling period; under the canopy of plants, OC levels were lower in winter, spring, and summer than in autumn (Fig. 3). The mean OC percentage under the canopies of the two types of plants was 0.4% in winter, spring, and summer. In autumn, a significant increase occurred, showing mean levels of 0.5 and 0.6% under the canopies of H. scoparia and A. halimus, respectively. In winter and spring, the control samples exhibited a mean value of 0.3%. A decrease was measured toward summer, reaching a mean of 0.2%, which increased in autumn to 0.3% OC.
FIG. 3.
Changes in OC content under the plant canopies of A. halimus (a) and H. scoparia (b) and in the control group (c) during the four seasons: winter, spring, summer, and autumn.
Protozoa.
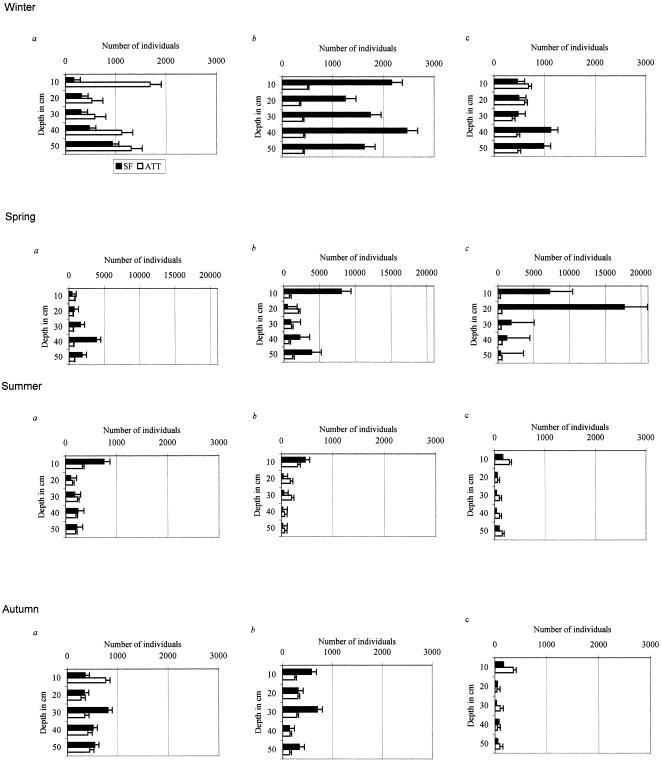
The total number of protozoa (Fig. 4) was found to be significantly higher in winter and spring than in summer and autumn (P < 0.001). Due to the significant differences in the population sizes from season to season, the scales in Fig. 4 were adjusted accordingly.
FIG. 4.
Changes in total amoeba population (amoeba total types [ATT]) and small-flagellate population (SF) under the plant canopies of A. halimus (a) and H. scoparia (b) and in the control group (c) during the four seasons: winter, spring, summer, and autumn.
The flagellate population (Fig. 4) reached a maximum level of 17,682 individuals g of dry soil−1 in the upper layer (0 to 10 cm) of the control soil samples in the spring. The highest population density of the amoeba population was 2,037 individuals g of soil−1 in samples taken under H. scoparia plants in the same season. In the control samples, the abundance of both the flagellate and the amoeba populations in autumn decreased to 5 and 40 individuals g of soil−1, respectively.
In winter, the flagellate population was significantly more abundant under the canopy of H. scoparia, reaching 2,462 individuals, whereas the amoeba population was more numerous under the canopy of A. halimus (1,688 individuals g−1). No significant differences were found between the two populations (605 amoebae and 492 flagellates) in the intershrub control samples in the 0- to 30-cm-deep layers. However, in the deeper layers (30 to 50 cm), the flagellate community was found to be more abundant, increasing to a population of 1,125 individuals. During springtime, in the deeper layers (40 to 50 cm), the flagellate population increased to 3,883 and was found to be higher than the amoeba population under the canopy of A. halimus. The amoeba population in the 0- to 10-cm layer remained higher than the flagellate population; the same was true for their populations during the winter. The flagellate populations under the canopy of H. scoparia and in the bare soil were significantly higher than the amoeba populations in most of the layers, except for the 10- to 20-cm layer under the canopy of H. scoparia, which exhibited a significantly larger amoeba population (P < 0.001).
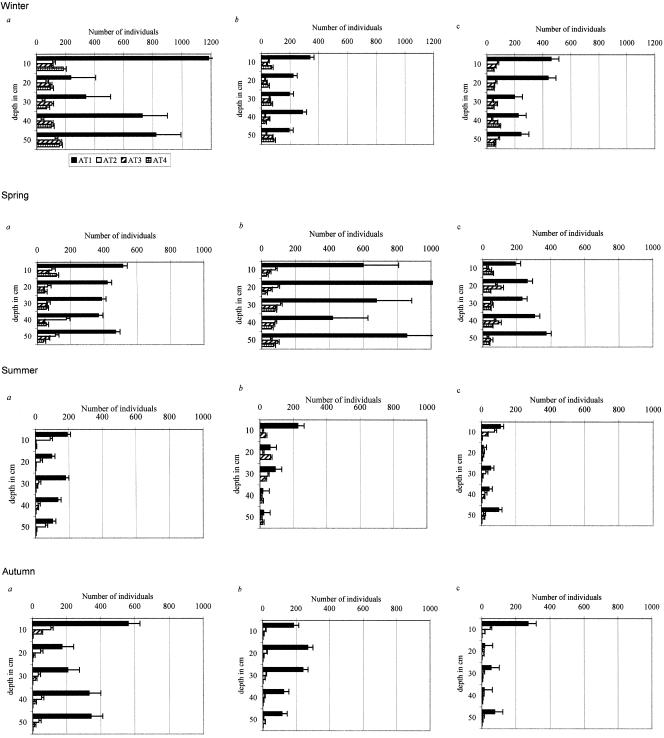
The four types of amoeba populations (Fig. 5) had similar patterns of dispersal throughout the year and in all samples. The type 1 (e.g., Acanthamoeba and Filamoeba) population was the most abundant and was significantly more abundant (P < 0.001) than the other types. In order of abundance, type 1 was followed by type 3 (e.g., Naegleria), and then by type 2 (e.g., Hartmannella), and finally by type 4 (e.g., Vannella).
FIG. 5.
Changes in the different amoeba types (amoeba type 1 [AT1] to AT4) under the plant canopies of A. halimus (a) and H. scoparia (b) and in the control group (c) during the four seasons: winter, spring, summer, and autumn.
In winter and spring, the type 1 population comprised about 65% of the total amoeba population under A. halimus. During the summer, when the soil was drier, the percentage of type 1 amoebae increased significantly (P < 0.01) to 77%, and then during autumn it decreased to 66%. A different pattern was found under the canopy of H. scoparia: the type 1 population during winter was about 48% of the total amoeba population. The percentage of type 1 amoebae increased during spring to a mean of 63% and returned to 48% during the summer. In autumn, the percentage of the type 1 community increased significantly (P < 0.001) and was 83% of the total amoeba population. In the bare soil, the percentage of the total type 1 amoeba community was constant, with a mean of 56% throughout the year. No significant differences were observed among the other three types within all groups of samples during the different seasons, and the percentages of these three types within the total community were affected by the changes in the type 1 amoebae.
DISCUSSION
Soil moisture and organic matter fluctuations throughout the study period allowed us to define three different microenvironmental niches, where litter accumulation was possibly one of the main triggers affecting biotic composition and dynamics in the soil profile. A. halimus, also known as the “salt bush,” which has the ability to accumulate organic matter beneath it, is known to affect moisture availability along the plant rhizosphere (32, 33). H. scoparia is a leafless stem saltwood (as defined by Evenari et al. [14]) with low organic matter accumulation and was found to impose a harsher environment yet create a better niche for annual plants and soil biota, even for short periods (23). The third well-defined niche was the open, bare sites of intershrub, where abiotic variables determined levels of soil moisture and organic matter availability along the soil profile. Each of the three niches responds differently in time and space to the unpredictable abiotic triggers of the desert ecosystem.
The different ecophysiological adaptations of the two halophytes affect the patterns of organic matter and soil moisture dynamics along the roots, triggering different populations and population densities of the microflora community, which in turn affect the protozoan community composition and density. In a study undertaken in a forest ecosystem, Ekelund et al. (13) showed that soil moisture and organic matter are not sufficient for protozoan populations to fulfill their function. They found high bacterial and fungal biomass contents, as well as soil moisture, but no protozoa were found deeper than 30 cm. In the present study, we found a moderately high number of amoebae (more than 500 g of soil−1) in the 40- and 50-cm depths, although the percentage of soil organic matter was significantly lower than in the upper soil layer. These results differ from those obtained from forest ecosystems (13).
A. halimus was found to be able to provide convenient conditions for the amoeba population throughout the year, with high numbers of individuals even in the dry seasons. The other two microenvironments were found to have conditions similar to those of A. halimus only during winter and spring. This pattern may be due to the presence of a biological factor under the canopy of A. halimus that might enhance microbial activity during these seasons. Such a factor might be the root exudates, since it has been proposed that plants can direct the microbial-community composition and dynamics in their rhizosphere (20). Other factors, such as macrofaunal activity underneath the shrub, might incorporate organic matter (10-12, 16) and establish islands of fertility, encouraging the prosperity of the protozoon population.
The pattern of having one very abundant morphotype during the year and the other three appearing intermittently was also observed in previous studies of a water column (5) and of sediments (4). These patterns were related to general regional factors affecting the predator-prey relationship, and the total number of amoebae simply reflected the total number of bacteria in the soil (4), which could also be the case in our study. Flagellates might also be considered additional prey, since the larger amoebae (normally, several species of type 4) feed on them and on smaller amoebae during the more productive seasons. Flagellates are able to move within and between the smaller soil pores, and they prey upon bacteria only. Therefore, they can appear only when the population of small bacteria increases to support flagellate predation. As a consequence, the food web complexity increased during winter, allowing the explosive growth of the flagellate population and the appearance of the four morphological types of amoebae.
The second-most-abundant amoeba group in the soils was the type 3 group (genera Vahlkampfia, Naegleria, Willaertia, Tetramitus, Paratetramitus, and Adelphamoeba). This type of amoeba was less tolerant to lower soil moisture availability than type 1 amoebae but was still more resistant to dry conditions than types 2 and 4, which were found to be less dominant.
In the present study, no correlations were found on a temporal and spatial basis among the four amoeba morphotypes. This finding may raise the question of how each type of amoeba responds to different abiotic, biotic, and/or predator-prey triggers.
In the present study, by using a food web generalization, the four types of amoeba populations were divided into two main groups according to their food preferences. The first group (1) includes the type 1 amoeba populations. They can be defined as the “persister” groups, which are known (i) to be omnivores, feeding on bacteria, yeasts, algae, fungi, and even microinvertebrates; (ii) to fulfill their ecological functions under extreme environmental conditions; and (iii) to adapt to long periods of dehydration (e.g., members of the genus Acanthamoeba) (20). The second group (3) contains the remaining three amoeba types and can be defined as “colonizers,” known to be bacterium feeders and to be sensitive to low soil moisture availability.
The generalization that protozoan populations are not present in soil columns below 20 cm in pristine soils, as reported, should be reconsidered in the context and under the conditions of that particular environment. In our study in the Negev Desert, with the fluctuations in temperature and moisture availability in the upper layer of soil, soil biota telescopic movement was oriented to the deeper soil layers (26, 28-30).
Based on our study, we assume that protozoan populations can be active in the deep soil layers, down to a depth of 50 cm. These layers are worth studying in order to understand the nutrient cycling and functioning of the Negev Desert ecosystem.
Acknowledgments
We thank Sina Adl for his constructive comments. We also thank Ginetta Barness for providing technical assistance.
REFERENCES
- 1.Alexander, M. 1977. Introduction to soil microbiology. John Wiley and Sons, New York, N.Y.
- 2.American Public Health Association, American Water Works Association, and Water Pollution Control Facility. 1992. Metodos normalizados para el analisis de aguas residuales y potables. Diaz de Santos, S.A., Madrid, Spain.
- 3.Anderson, O. R. 2002. Laboratory and field-based studies of abundances, small-scale patchiness, and diversity of gymnamoebae in soils of varying porosity and organic content: evidence of microbiocoenoses. J. Eukaryot. Microbiol. 49:17-23. [DOI] [PubMed] [Google Scholar]
- 4.Anderson, O. R., T. Gorrell, A. Bergen, R. Kruzansky, and M. Levandowsky. 2001. Naked amoebas and bacteria in an oil-impacted salt marsh community. Microb. Ecol. 42:474-481. [DOI] [PubMed] [Google Scholar]
- 5.Anderson, O. R., and A. Rogerson. 1995. Annual abundances and growth-potential of gymnamoebae in the Hudson estuary with comparative data from the Firth of Clyde. Eur. J. Protistol. 31:223-233. [Google Scholar]
- 6.Clarholm, M. 1985. Interactions of bacteria, protozoa and plants leading to mineralization of soil nitrogen. Soil Biol. Biochem. 17:181-187. [Google Scholar]
- 7.Coleman, D. C. 1985. Through a ped darkly: an ecological assessment of root-soil-microbial-faunal interactions, p. 1-21. In A. H. Fitter, D. Atkinson, D. J. Read, and M. B. Usher (ed.), Ecological interactions in soil. Blackwell Scientific Publications, Cambridge, United Kingdom.
- 8.Coleman, D. C. 1994. The microbial loop concept as used in terrestrial soil ecology studies. Microb. Ecol. 28:245-250. [DOI] [PubMed] [Google Scholar]
- 9.Dan, J., D. H. Yaalon, H. Royumdji, and Z. Raz. 1972. The soil association map of Israel (1:1,000,000). Isr. J. Earth Sci. 2:29-49. [Google Scholar]
- 10.Degen, A. A. 1988. Ash and electrolyte intakes of the fat sand rat, Psammomys obesus, consuming saltbush, Atriplex halimus, containing different water content. Physiol. Zool. 61:137-141. [Google Scholar]
- 11.Degen, A. A., M. Kam, and D. Jurgrau. 1988. Energy-requirements of fat sand rats (Psammomys obesus) and their efficiency of utilization of the saltbush Atriplex halimus for maintenance. J. Zool. (Oxford) 215:443-452. [Google Scholar]
- 12.Degen, A. A., B. Ponshow, and M. Ilan. 1990. Seasonal water flux, urine and plasma osmotic concentrations in free-living fat sand rats feeding solely on saltbush. J. Arid Environ. 18:59-66. [Google Scholar]
- 13.Ekelund, F., R. Ronn, and S. Christensen. 2001. Distribution with depth of protozoa, bacteria and fungi in soil profiles from three Danish forest sites. Soil Biol. Biochem. 33:475-481. [Google Scholar]
- 14.Evenari, M. E., L. Shanan, and W. Tadmore. 1982. The Negev: the challenge of a desert. Harvard University Press, Cambridge, Mass.
- 15.Fenchel, T. 1987. Ecology of protozoa: the biology of free-living phagotrophic protists. Springer-Verlag, Berlin, Germany.
- 16.Kam, M., and A. A. Degen. 1989. Efficiency of use of saltbush (Atriplex halimus) for growth by fat sand rats (Psammomys obesus). J. Mammal. 70:485-493. [Google Scholar]
- 17.Kinner, N. E., R. W. Harvey, K. Blakeslee, G. Novarino, and L. D. Meeker. 1998. Size-selective predation on groundwater bacteria by nanoflagellates in an organic-contaminated aquifer. Appl. Environ. Microbiol. 64:618-625. [DOI] [PMC free article] [PubMed] [Google Scholar]
- 18.Noy-Meir, I., M. Gutman, and Y. Kaplan. 1989. Responses of Mediterranean grassland plants to grazing and protection. J. Ecol. 77:554-575. [Google Scholar]
- 19.Robinson, B. S., S. S. Bamforth, and P. J. Dobson. 2002. Density and diversity of protozoa in some arid Australian soils. J. Eukaryot. Microbiol. 49:449-453. [DOI] [PubMed] [Google Scholar]
- 20.Rodriguez-Zaragoza, S., and S. Garcia. 1997. Species richness and abundance of naked amoebae in the rhizoplane of the desert plant Escontria chiotilla (cactaceae). J. Eukaryot. Microbiol. 44:122-126. [Google Scholar]
- 21.Rowell, D. L. 1994. Soil science: methods and applications. Longman Group UK Ltd., London, United Kingdom.
- 22.Sandon, H. 1927. The composition and distribution of the protozoan fauna of the soil. Oliver and Boyd, Edinburgh, United Kingdom.
- 23.Sarig, S., G. Barness, and Y. Steinberger. 1994. Annual plant-growth and soil characteristics under desert halophyte canopy. Acta Oecol. 15:521-527. [Google Scholar]
- 24.Schlesinger, W. H., J. A. Raikes, A. E. Hartley, and A. F. Cross. 1996. On the spatial pattern of soil nutrients in desert ecosystems. Ecology (Washington, D.C.) 77:364-374. [Google Scholar]
- 25.Singh, B. N. 1975. Pathogenic and non-pathogenic amoebae. The Macmillan Press Ltd., London, United Kingdom.
- 26.Steinberger, Y. 1995. Soil fauna in arid ecosystems: their role and functions in organic matter cycling. Adv. Geoecol. 28:29-36. [Google Scholar]
- 27.Stout, J. D. 1980. The role of protozoa in nutrient cycling and energy flow. Adv. Microb. Ecol. 4:1-50. [Google Scholar]
- 28.Wallwork, J. A. 1970. Ecology of soil animals. McGraw-Hill, London, United Kingdom.
- 29.Wallwork, J. A. 1982. Desert soil fauna. Praeger, New York, N.Y.
- 30.Whitford, W. G. 2002. Ecology of desert systems. Academic Press, New York, N.Y.
- 31.Xie, G. H., and Y. Steinberger. 2001. Temporal patterns of C and N under shrub canopy in a loessial soil desert ecosystem. Soil Biol. Biochem. 33:1371-1379. [Google Scholar]
- 32.Zohary, M. 1973. Geobotanical foundations of the Middle East, vol. 1. G. Fischer, Stuttgart, Germany.
- 33.Zohary, M.1973. Geobotanical foundations of the Middle East, vol. 2. Swets and Zeinlinger, Amsterdam, The Netherlands.


