FIG. 3.
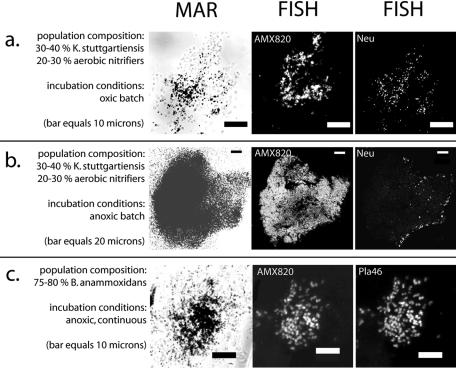
MAR-FISH (22). Panels A to C present the results of one experiment. The MAR signal is shown in the first column; the other two columns give FISH images of the same area and indicate the probes that were used. Probe AMX820 (S-*-Amx-0820-a-A-22) and probe Pla46 (S-P-Planc-0046-a-A-18) are listed in Table 1. Details for probe Neu can be found at the ProbeBase website (23). Shown are the labeling patterns of a mixed culture containing “Ca. Kuenenia stuttgartiensis” (30 to 40%) and Nitrosomonas eutropha (30 to 40%) after aerobic incubation with ammonium (A), of the same culture after anaerobic incubation with ammonium and nitrite (B), and of an enrichment culture of “Ca. Kuenenia stuttgartiensis” (70 to 80%) after 24-h labeling in a continuous setup, under nitrite limitation (C).

