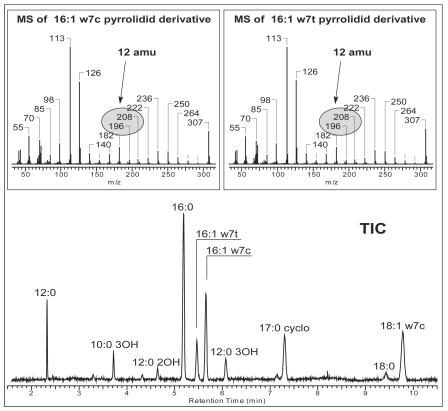
FIG. 3.
GC-MS-total ion chromatogram (TIC) of fatty acid methyl esters of P. putida NCTC 10936 in a polar column (DB-23). The sample used was the same as that described for Fig. 2B. Mass spectra of the peaks representing 16:1ω7c and 16:1ω7t after derivatization of the fatty acid methyl esters to their corresponding pyrrolidide compounds are shown above the total ion chromatogram.

