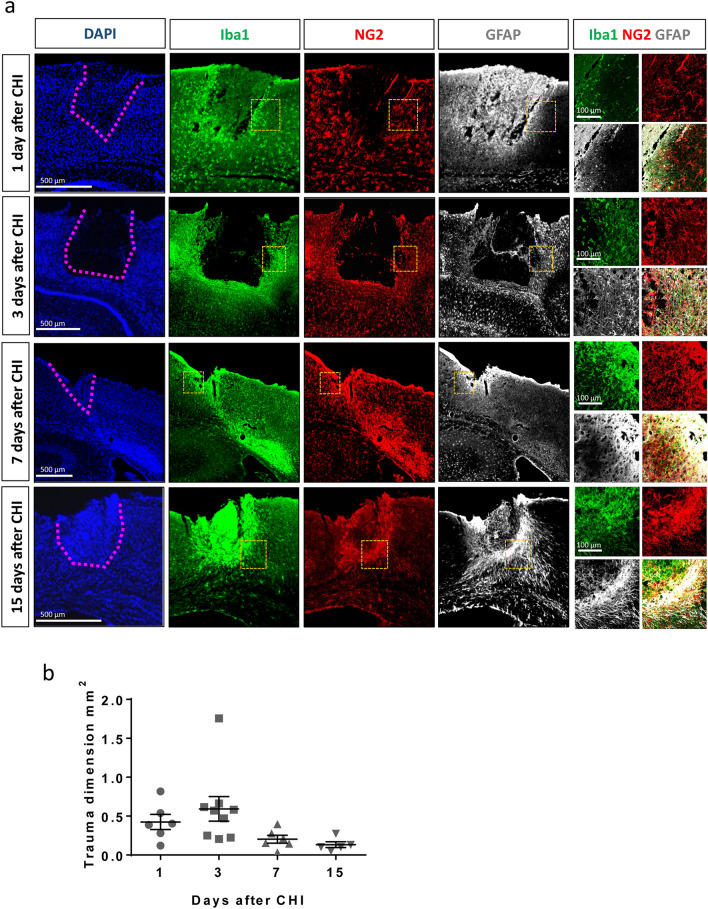
Figure 3.
Spatial reaction of glial cells after CHI and reduction of lesion size over time. (a) IHC shows the progressive accumulation of Iba1+ cells around and within the trauma site (the borders of the trauma site are highlighted by the pink dotted line in the left panel), while NG2-glia and GFAP+ astrocytes surround the lesion. Yellow dotted squares show the position of the higher-magnification images (right panels), used to highlight the colocalization of the different markers. (b) No significant reduction in the primary trauma dimension per slice is observed over time (one-way ANOVA with Tukey's post hoc test). Data are presented as the mean ± SEM.

