Figure 5.

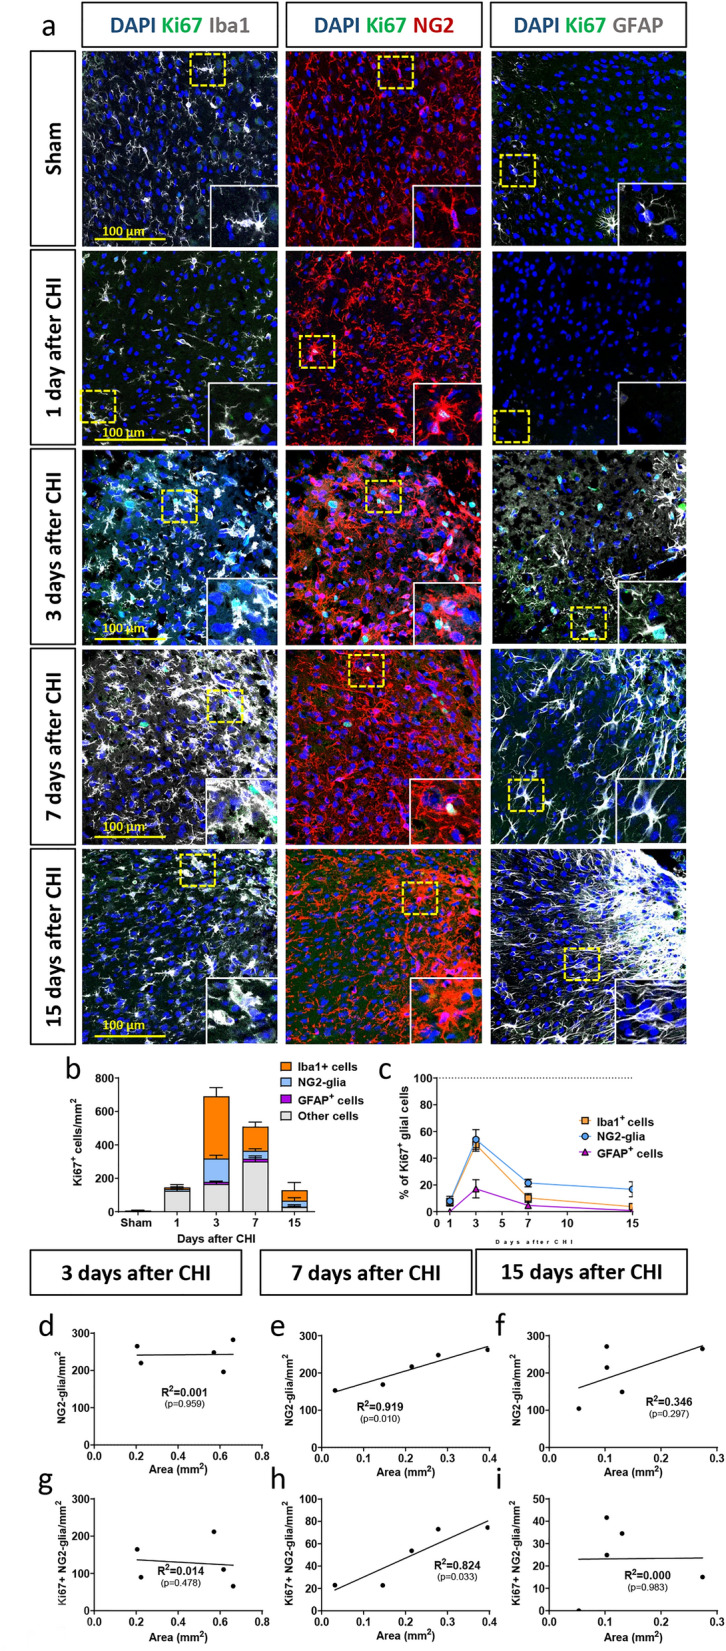
Active proliferation of glial cells changes after injury over time. (a) IHC analysis of Iba1+ cells (in gray, left panel), NG2-glia (in red, middle panel), GFAP+ astrocytes (in gray, right panel), and actively proliferating Ki67+ cells (in green) after CHI. In the images, CHI is located in the upper right corner. Higher magnification images of single cells (yellow dotted line) are shown in insets. (b) Quantification and identity of Ki67+ cells, which represent the acute proliferating cells at the timepoint of sacrifice; (c) percentages of all Iba1+ cells, NG2-glia, and GFAP+ cells that are also Ki67+ at the different time points. Correlation of lesion size at 3 (d,g), 7 (e,h) and 15 (f,i) days after trauma with the total number of NG2-glia (d–f) and Ki67+ NG2-glia (g–i). A correlation between the size of the lesion and the reaction of NG2-glia could only be observed at 7 days after trauma (e,h). Data are plotted along with the line of fit determined by linear regression analysis. Significance was calculated with R2 and p < 0.05.
