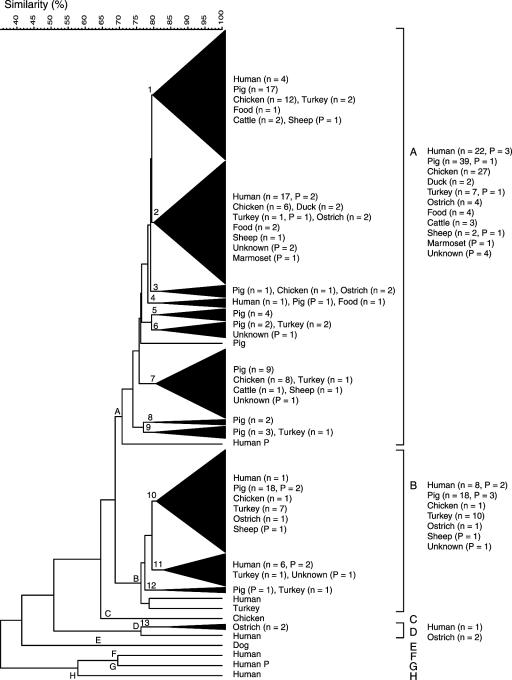
FIG. 1.
Dendrogram derived from numerical comparison of AFLP profiles of 174 C. coli isolates of human and animal origin, by use of Dice similarity and UPGMA clustering coefficients. Phenons (A to H) are defined at the 70.8% S level, and subphenons (including two or more isolates) (1 to 13, triangulated) at the 79.6% S level. Source and number of field isolates (n), and Penner reference strains (P) in phenons and subphenons are indicated to the right.

