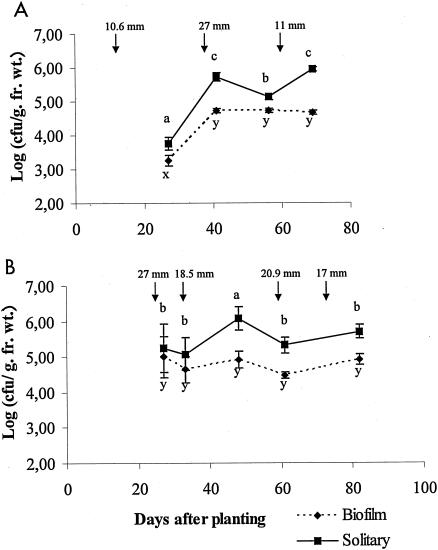
FIG. 2.
X. axonopodis pv. phaseoli population dynamics on bean leaflets for two field experiments (1999 [A] and 2000 [B]) and two cultivars (Michelet [A] and Contender [B]). Epiphytic bacterial populations are divided into solitary and biofilm fractions. Error bars represent the standard error of the mean. For a given fraction of the population in each experiment mean population sizes followed by different letters are significantly (P < 0.05) different on the basis of the Newman-Keuls test. Water amounts of every rainfall higher than 10 mm are indicated by arrows. fr. wt., fresh weight.

