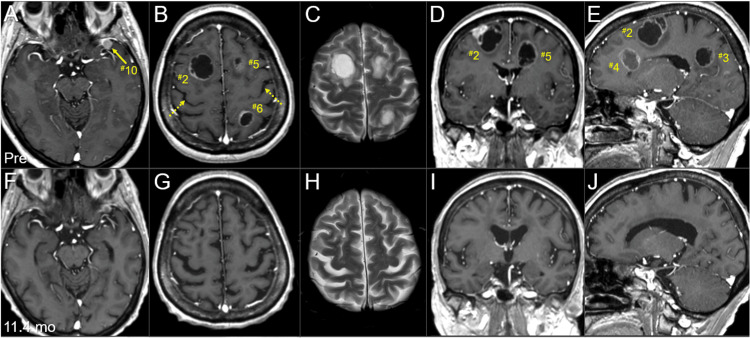
Figure 3. Magnetic resonance images at the diagnosis and last examination, mainly focusing on the boost lesions in the right hemisphere.
The images show CE T1-WIs (A, C, E, G, I, K); T2-WIs (B, D, H, J); axial images (A-C, F-H); coronal images (D, I); sagittal images in the right hemispheres (E, J); three days before the initiation of WBRT (pre) (A-E); and 11.4 months after the WBRT initiation (F-J).
(A-J) These images are shown at the same magnification and coordinates under co-registration and fusions based on the pre-irradiation images (A, F: the same cross-section; B, C, G, H: the same section). (A-E) Six lesions are observed, most of them cystic, with some solid components (#2,4,5). An extra-parenchymal dura-based lesion (#10) is solid. (B) The central sulci are indicated by dashed arrows. (E) Two large lesions (#2,4) in the right frontal lobe are in close proximity. (F-J) At 11.4 months, all the seven lesions had remarkably regressed or almost disappeared.
CE: contrast-enhanced; WIs: weighted images; WBRT: whole-brain radiotherapy

