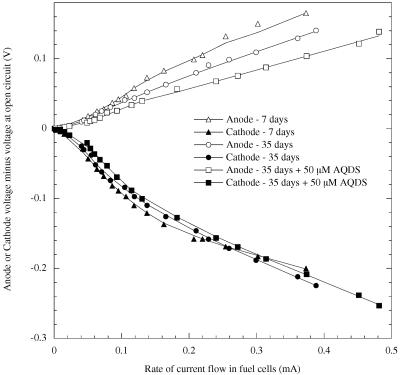
FIG. 4.
Overvoltages for anodes and cathodes in a representative G. fermentans fuel cell over a range of current densities. Characteristics were measured 7 days after medium replacement (▵, ▴), in the same fuel cell 35 days after medium replacement (○, •), and with 50 μM AQDS addition 1 day later (□, ▪). Values closer to zero as the rate of current flow increases indicate improvements in operating cell voltage.

