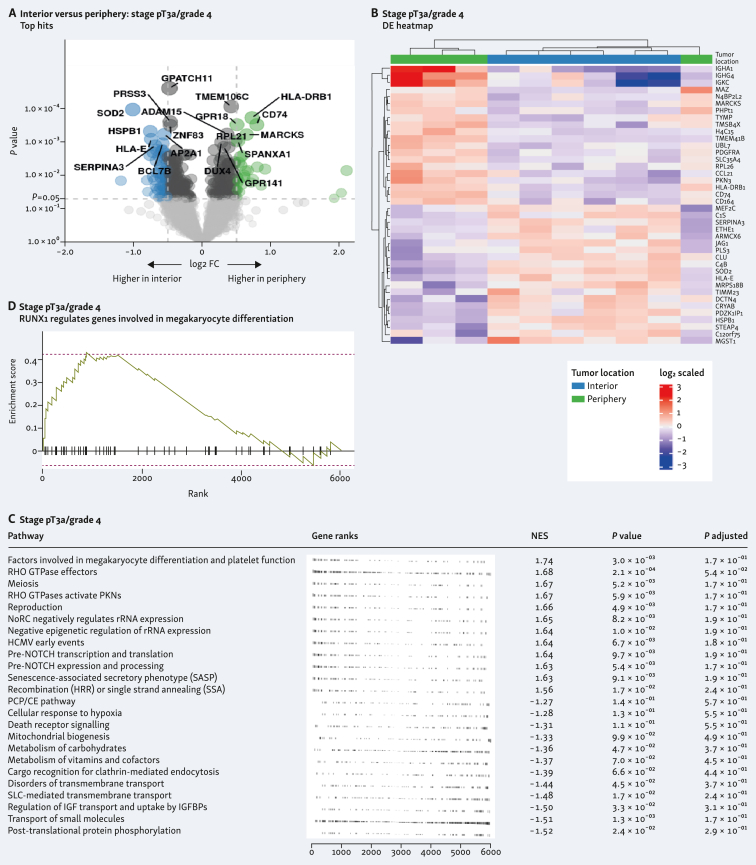
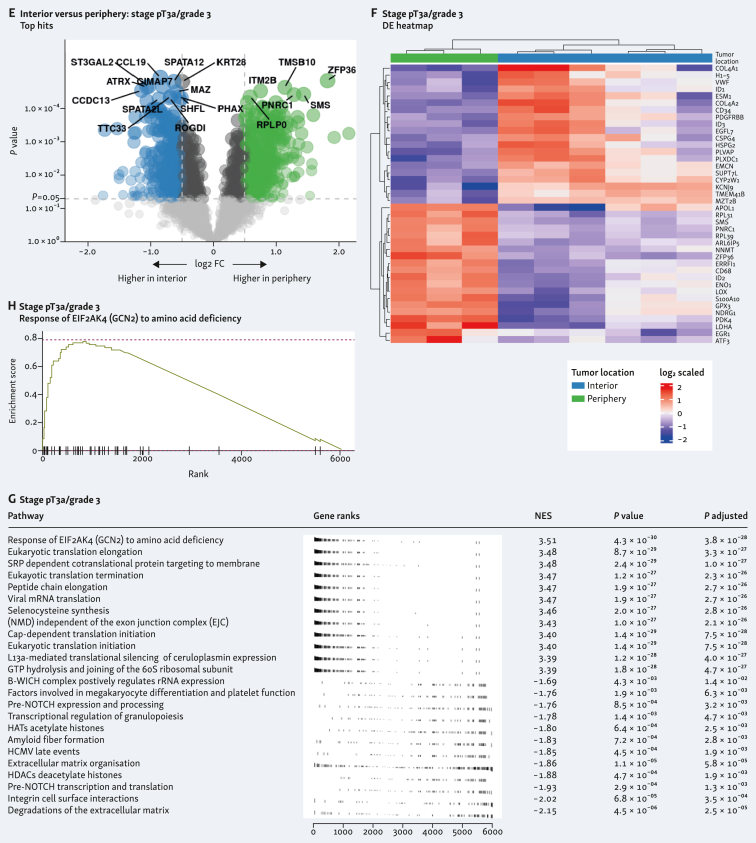
Figure 2.
Differentially expressed genes and pathway analysis within clear-cell renal cell carcinoma (ccRCC) tumor types comparing tumor interior and tumor periphery. Differential expression of genes displayed in volcano plots of interior versus periphery is shown in A (stage pT3a/grade 4) and E (stage pT3a/grade 3). Heatmaps corresponding with interior versus periphery are shown in B (stage pT3a/grade 4) and F (stage pT3a/grade 3). Gene set enrichment analysis (GSEA) for each tumor type is shown in C (stage pT3a/grade 4) and G (stage pT3a/grade 3) comparing tumor interior versus periphery and top differentially expressed pathway shown in D (stage pT3a/grade 4) and H (stage pT3a/grade 3). CE, convergent extension; FC, fold change; HATs, histone acetyltrasnsferases; HCMV, human cytomegalovirus; HDACs, histone deacetylaces; mRNA, messenger RNA; NoRC, nucleolar remodeling complex; PCP, planar cell polarity; PKN, protein kinase N; rRNA, ribosomal RNA; SLC, solute carrier.


