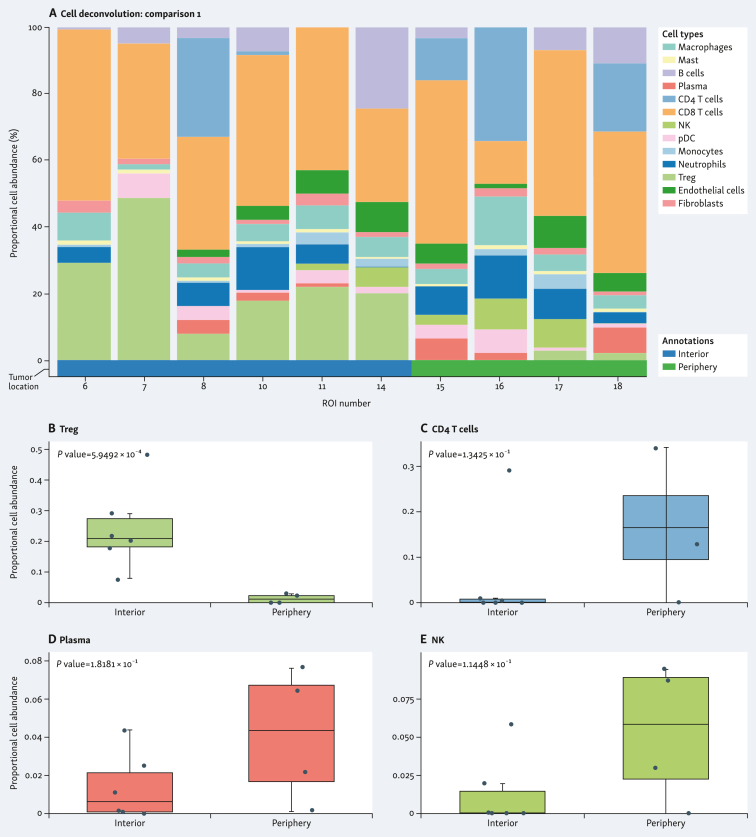
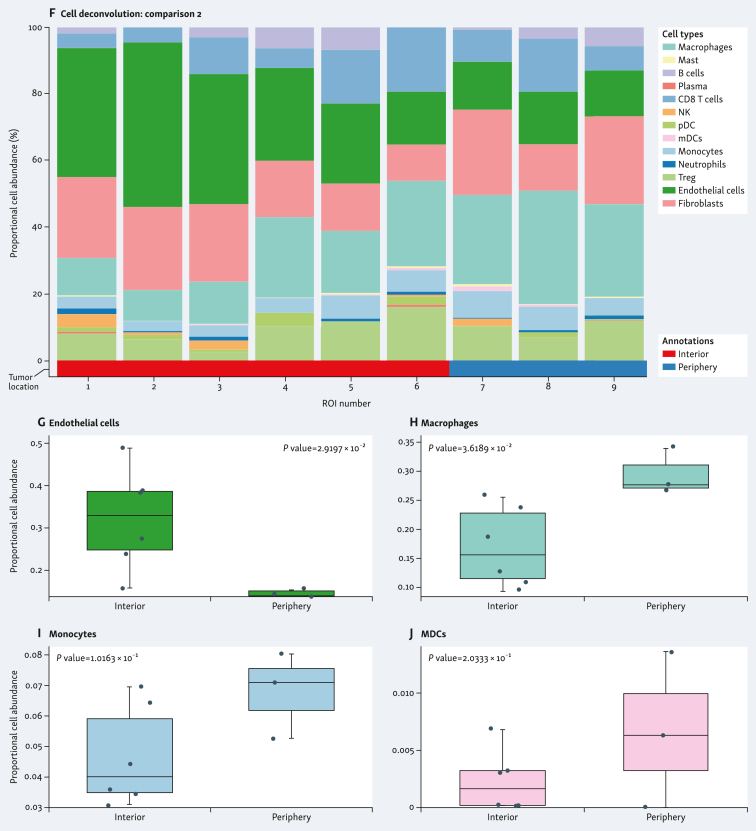
Figure 4.
Spatial cell type deconvolution in sample specimens. Cell deconvolution within tumor types (A-E, stage pT3a/grade 4; F-J, stage pT3a/grade 3) comparing tumor interior [blue in stage pT3a/grade 4 (A); red in stage pT3a/grade 3 (F)] and tumor periphery [green in stage pT3a/grade 4 (A); blue in stage pT3a/grade 3 (F)]. Proportional cell abundance is shown in each graph. (B-E and G-J) Most differentially expressed cell types in each tumor type are shown. MDCs, myeloid dendritic cells; NK, natural killer; ROI, region of interest; Treg, regulatory T cells.


