. 2024 Jan 30;14(6):4129–4141. doi: 10.1039/d3ra08481g

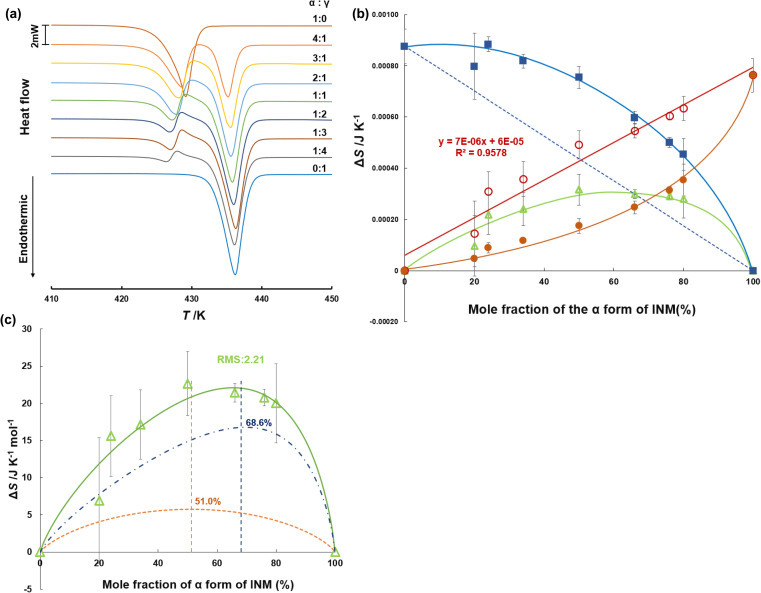
Fig. 3. (a) Differential scanning calorimetry (DSC) thermograms of INM at various mole fractions of α- and γ-forms. The temperature was raised at a rate of 5.0 K min−1, and the sample volume was 5 mg (n = 3). (b) Entropy of fusion of α- and γ-forms at various mole fractions of polymorphs; measured ΔfusSα (closed circles), ΔtrnSα→γ (open triangles), ΔfusSα (open circles), measured ΔfusSγ (closed squares), ΔfusSγ (dotted line). (c) Entropy changes of the α/γ-phase transition at various mole fractions of polymorphs (solid line), obtained by the sum of the mixing entropy (dashed line) and the asymmetric equation (dashed-dotted line), considering the site percolation model.

Fig. 3