
Fig. 2.
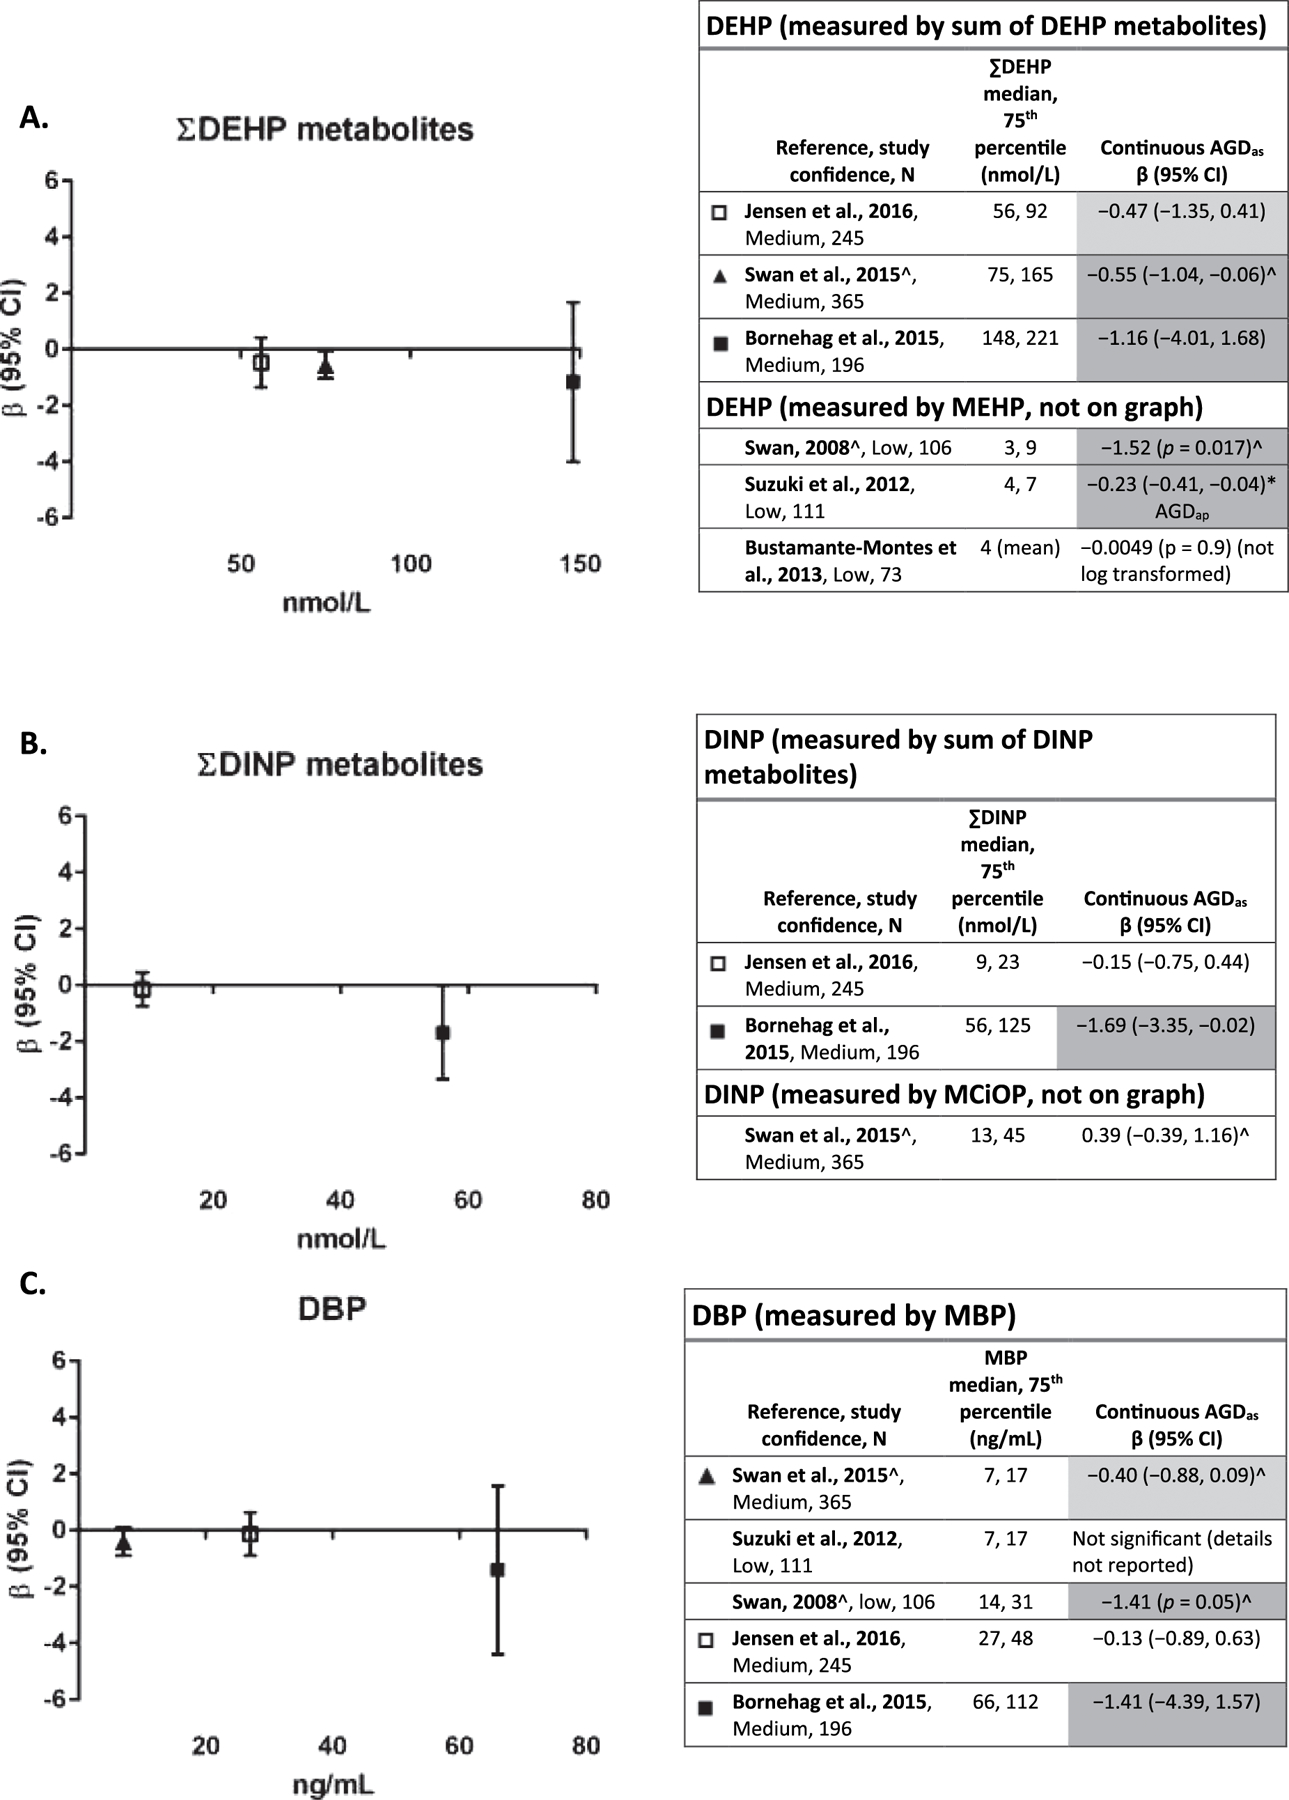
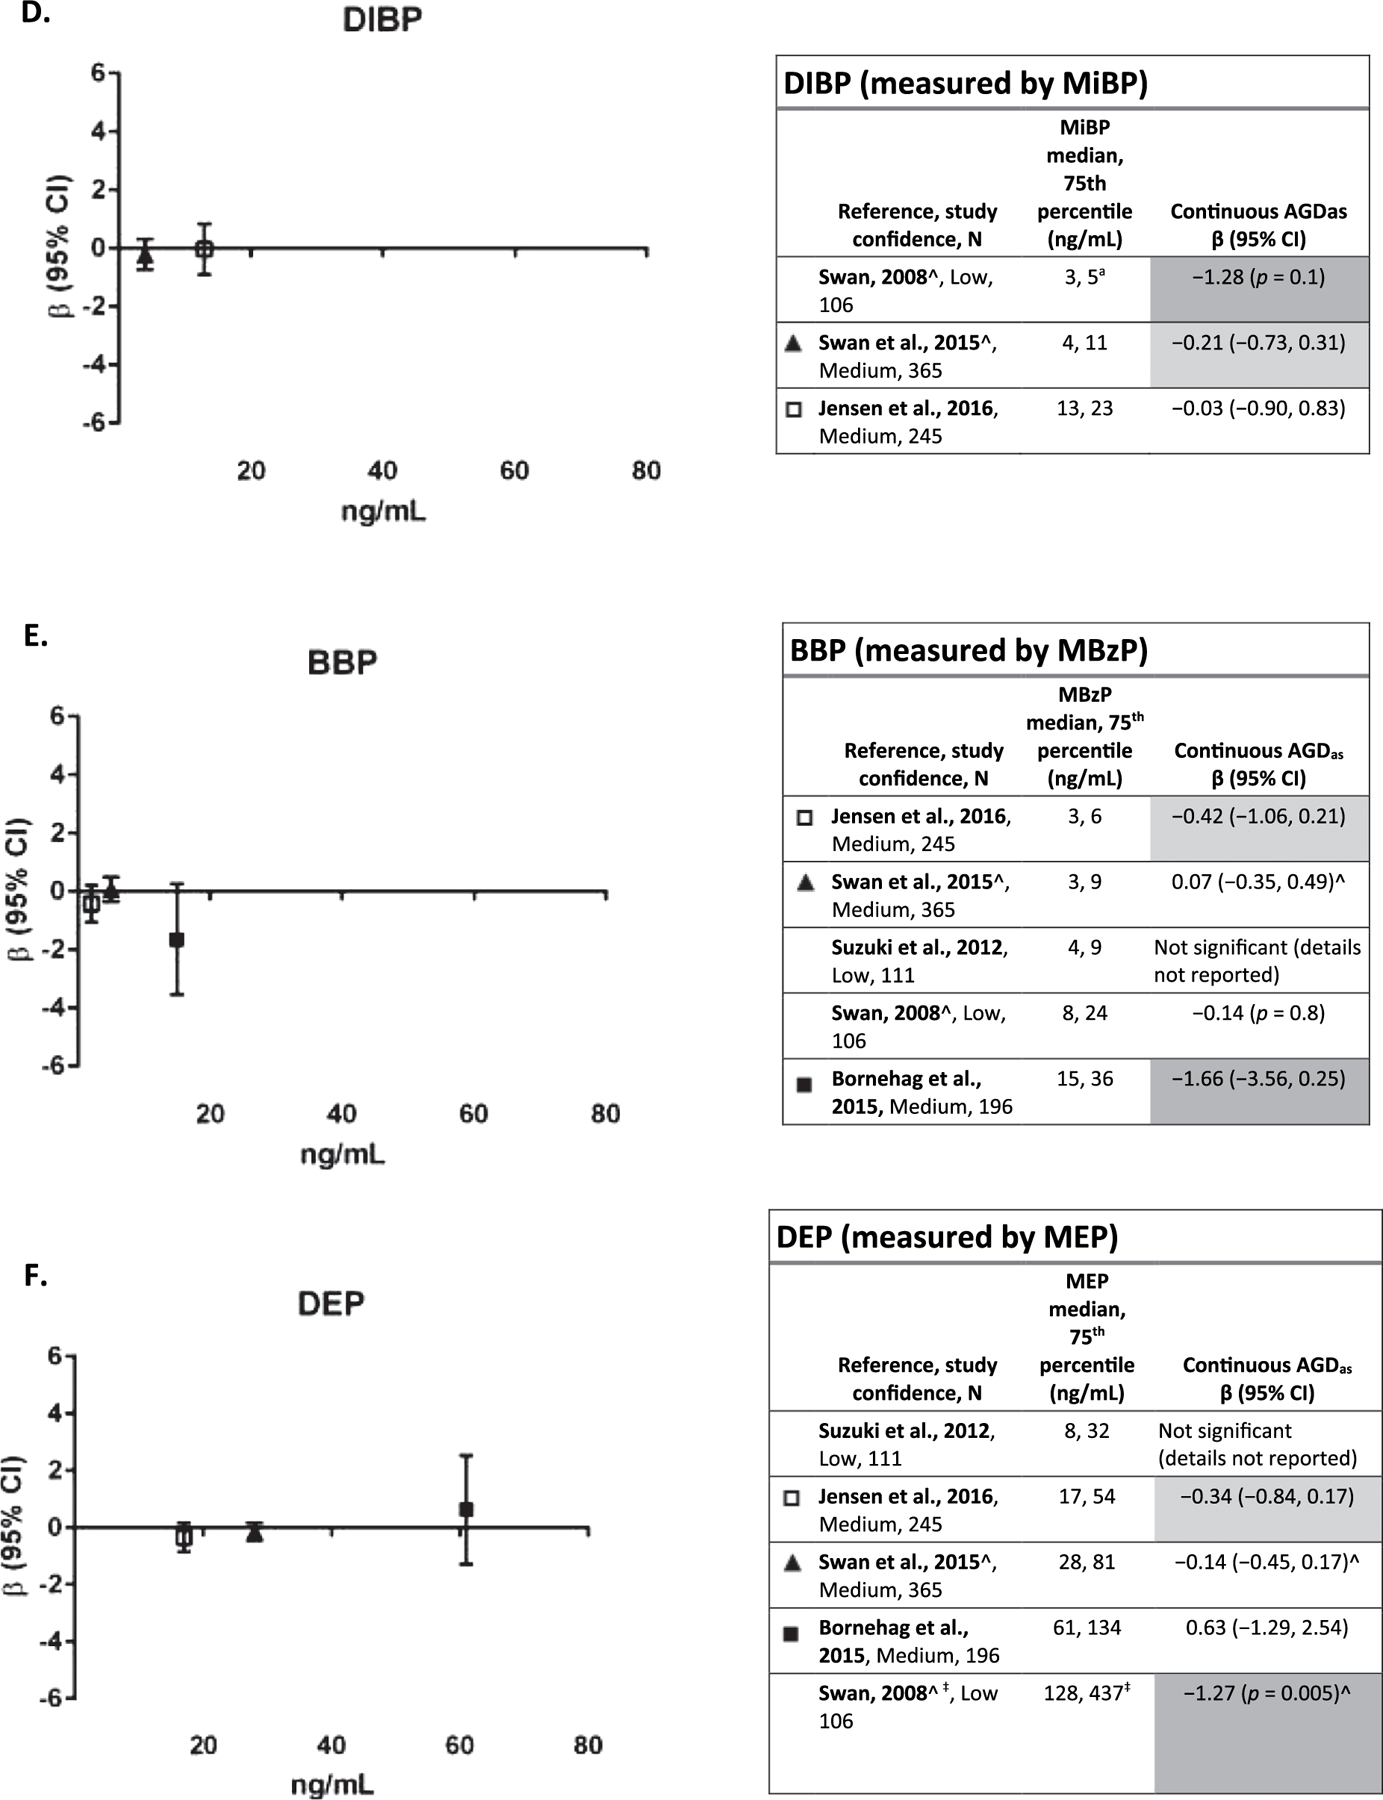
A–F. Association between phthalate metabolite levels measured in maternal urine samples during pregnancy and AGD in boys.
*p < 0.05, results that support an association are shaded. Dark gray represents one or more of the following: p < 0.05, large effect size (e.g., OR ≥ 1.5, β ≥ − 0.5), or exposure-response trend across categories of exposure. Light gray represents other supportive results.
^β recalculated to reflect ln transformation of metabolite (from log10).
‡Exposure levels from (Swan et al., 2015).
Exposure level on x-axis is population median for each study, and the axes are scaled the same for all phthalates to facilitate comparison of exposure levels, with the exception of DEHP and DINP, which were reported in nmol/L instead of ng/mL. Each panel depicts results for a metabolite(s) from a different parent phthalate. Studies within each phthalate are sorted by exposure levels. Effect estimates are change in anogenital distance in mm per ln-unit of exposure.