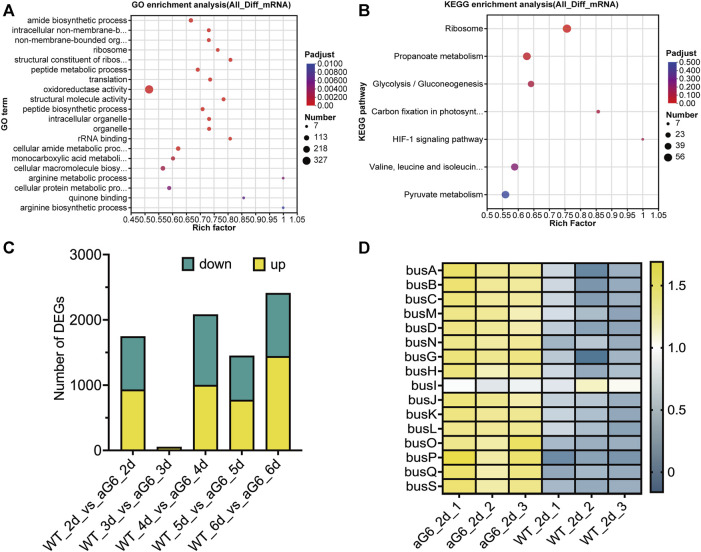
FIGURE 5.
Transcriptome analysis of aG6 and wild-type strain WT. (A) Bubble plot of the most significant pathways with KEGG enrichment of DEGs. (B) Bubble plot of the most significant pathways with GO enrichment of DEGs. (C) Comparative transcriptome analysis of the DEGs between strains aG6 and wild-type strain WT after cultivation for 2, 3, 4, 5 and 6 days. (D) Hierarchical clustering of genes in butenyl-spinosyn biosynthesis gene cluster at day 2.

