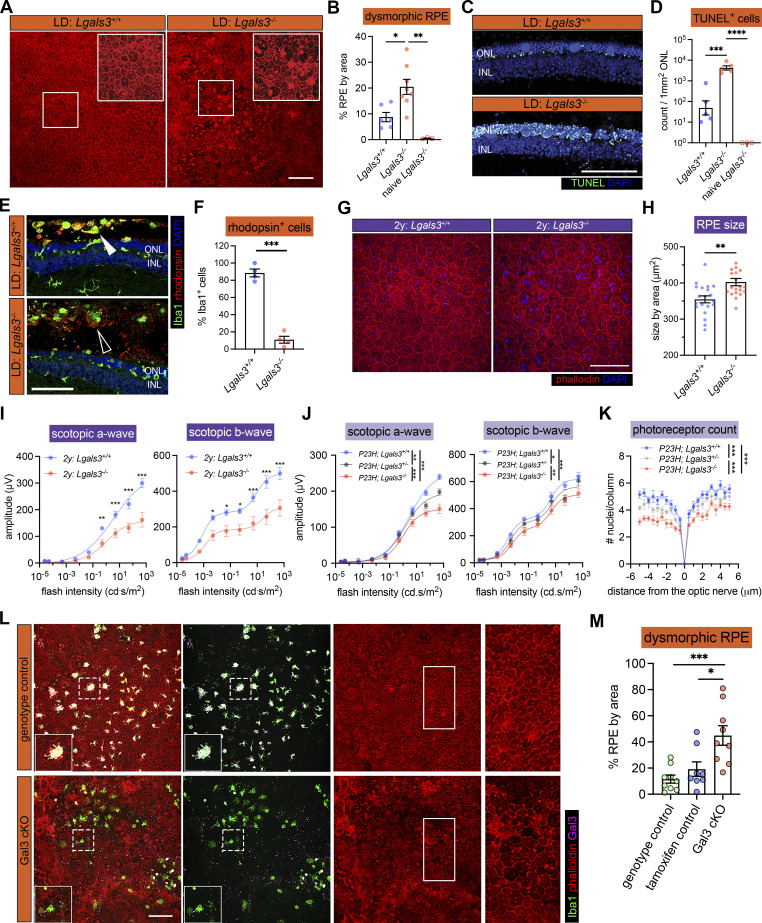
Figure 2.
Gal3 expressed by subretinal microglia is central in restricting disease progression in acute, genetic, and aging mouse models of retinal degeneration. (A) Images of phalloidin staining in WT and Lgals3−/− RPE tissues in LD. (B) Quantifications of dysmorphic RPE cells (n = 6, 7, and 3, respectively). (C) TUNEL (green) and DAPI (blue) staining in WT and Lgals3−/− retinal cross-sections in LD. INL, inner nuclear layer. (D) Quantifications of TUNEL+ photoreceptors in ONL (n = 5, 5, and 3, respectively). (E) Rhodopsin (red) and Iba1 (green) staining in WT and Lgals3−/− retinal cross-sections in LD. Images from single planes of confocal scans were shown. (F) Quantifications of rhodopsin+ subretinal microglia (n = 4 per group). (G) Images of phalloidin staining in WT and Lgals3−/− RPE tissues at 2 years (2y) of age. (H) Quantifications of RPE cell size. Dots represent individual images with n = 5 mice per group. (I) ERG data showing scotopic a- and b-waves in 2-year-old WT (n = 5) and Lgals3−/− (n = 5) mice. (J) Scotopic a- and b-waves of ERG data among Lgals3+/+ (n = 12), Lgals3+/− (n = 6), and Lgals3−/− (n = 10) in P23H mice. (K) Quantifications of ONL thickness among Lgals3+/+ (n = 7), Lgals3+/− (n = 7), and Lgals3−/− (n = 8) in P23H mice. (L) Representative images of dysmorphic RPE cells in Gal3 cKO in LD. Iba1, green; phalloidin, red; Gal3, magenta. (M) Quantifications of dysmorphic RPE cells in Gal3 cKO mice (n = 9) compared with genotype control (Cx3cr1CreER/+Lgals3fl/fl mice, n = 9) and tamoxifen control (Cx3cr1CreER/+ mice treated with tamoxifen, n = 8). Scale bars: 100 μm. Data were collected from two to three independent experiments. *: P < 0.05; **: P < 0.01; ***: P < 0.001; ****: P < 0.0001. One-way ANOVA with Tukey’s post hoc test (B, D, and M); unpaired Student’s t test (F and H); two-way ANOVA with Tukey’s post hoc test (I, J, and K).

