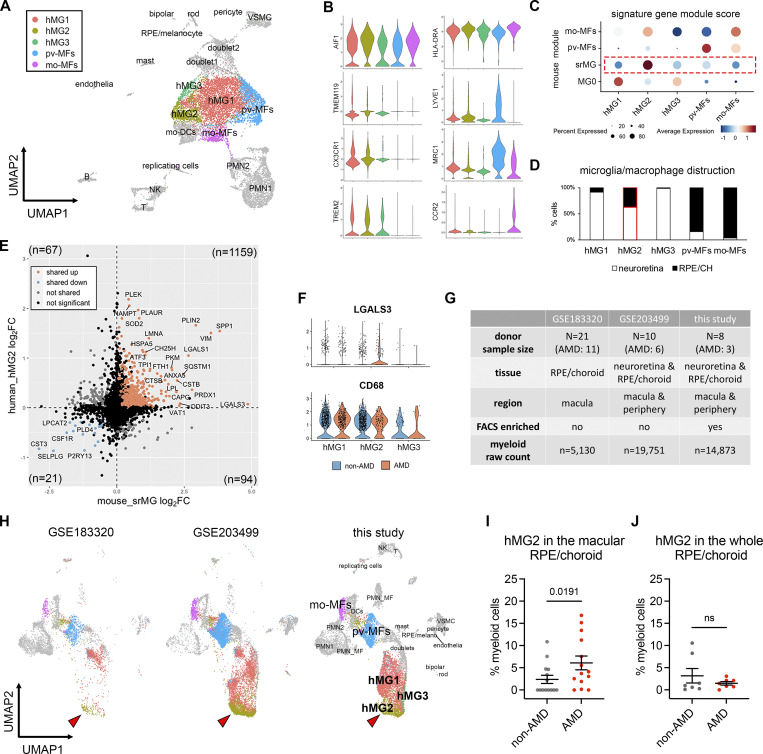
Figure 5.
Microglia at the sites of atrophy show a conserved phenotype between mice and humans and are enriched in the macula of AMD patients. (A) UMAP plot showing unsupervised clustering analysis of myeloid cells from human donors. CD45+CD11b+ cells were FACS-sorted from neuroretina and RPE/choroid tissues, respectively. hMG, human microglia; mo-MFs, monocyte-derived macrophages; pv-MFs: perivascular macrophages; mo-DCs, monocyte-derived dendritic cells; VSMC, vascular smooth muscle cells. (B) Violin plots showing the marker expression by macrophage clusters. (C) Dot plots showing gene module scores of human microglia/macrophage clusters. The gene modules were generated and normalized using the top 200 mouse markers from homeostatic microglia (MG0), subretinal microglia (srMG), pv-MFs, and mo-MFs. (D) Bar graphs showing the composition of macrophage/microglia clusters by tissues. The red box indicates the enrichment of cells from RPE/choroids in hMG2 cluster. (E) Comparison of gene expression between mouse subretinal microglia (x-axis) and human hMG2 (y-axis). The number in each quadrant shows the quantity of DEGs as indicated by colors. (F) Violin plots showing the expression of LGALS3 and CD68 by microglia clusters between non-AMD and AMD donors. (G) Summary of three independent human AMD scRNA-seq datasets. (H) UMAP plots showing the label transfer of myeloid cells among datasets. Arrowheads indicate hMG2 clusters in each dataset. (I and J) Quantifications of hMG2 frequencies in the whole and macular RPE/choroid tissues between non-AMD and AMD donors. Mann–Whitney test (one-tailed) was used, and P values are shown; ns: not significant.

