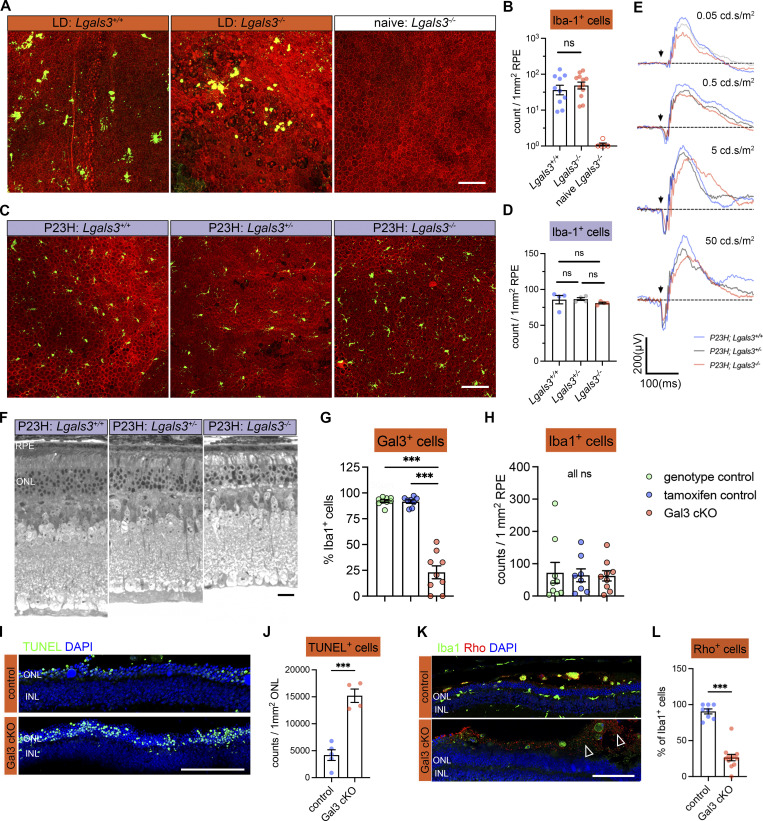
Figure S2.
Contributions of Gal3 to disease-related retinal pathology and to Iba1+ cell abundance in the subretinal space. (A) Iba1 (green) and phalloidin (red) staining in RPE flatmounts from LD-subjected mice as indicated. (B) Quantifications of subretinal Iba1+ cells shown in A. (C) Iba1 (green) and phalloidin (red) staining in RPE flatmounts from P23H mice as indicated. (D) Quantifications of subretinal Iba1+ cells as shown in C. (E) Examples of ERG responses at different flash intensities as indicated. (F) Representative retinal cross-sections of WT, Lgals3+/−, and Lgals3−/− in P23H mice. (G and H) Quantifications of Gal3 depletion efficiency (G) and frequencies of subretinal Iba1+ cells (H) in Gal3 cKO mice (n = 9) compared with genotype control mice (n = 9) and tamoxifen control (n = 8). (I) TUNEL (green) and DAPI (blue) staining in control and Gal3 cKO retinal cross-sections in LD. INL, inner nuclear layer. (J) Quantifications of TUNEL+ photoreceptors in ONL (n = 4 per group). (K) Rhodopsin (red) and Iba1 (green) staining in control and Gal3 cKO retinal cross-sections in LD. Images from single planes of confocal scans were shown. (L) Quantifications of rhodopsin+ subretinal microglia. Dots represent the percentage of each image. Scale bars: 100 μm. Data were collected from two to three independent experiments. ***: P < 0.001; ns: not significant. One-way ANOVA with Tukey’s post hoc test (B, D, G, and H); unpaired Student’s t test (J and L).

