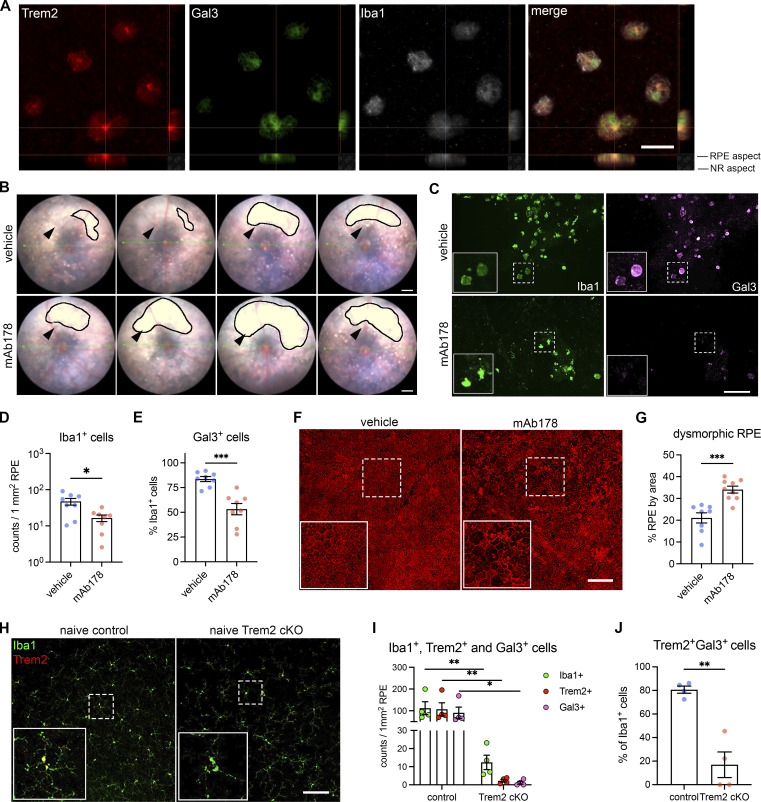
Figure S3.
Regulation by Trem2 signaling in subretinal microglia. (A) Split views of confocal scans show the colocalization of Trem2 (red), Gal3 (green), and Iba1 (white) in the subretinal microglia. Lines indicate the RPE-facing and neuroretina (NR)-facing aspects as indicated. Scale bar: 50 μm. (B) Fundus images show increased subretinal white lesions in anti-Trem2 mAb178-treated mice in LD, as indicated by arrowheads. Images of four individual mice per group are shown. Scale bar: 0.5 mm. (C) Images of Iba1 (green) and Gal3 (magenta) staining in subretinal microglia between control and mAb178-treated mice in LD. Scale bar: 100 μm. (D and E) Quantifications of Iba1+ cells and Gal3+ cells between control and mAb178 (n = 8 per group). (F) Images of phalloidin staining in RPE flatmounts from control and mAb178-treated mice in LD. Scale bar: 100 μm. (G) Quantifications of dysmorphic RPE cells between control (n = 8) and mAb178- (n = 9) treated mice. (H) Images of Iba1 (green) and Trem2 (red) in microglia from the inner retina of naïve control and Trem2 cKO mice. Scale bar: 50 μm. (I) Frequencies of Iba1+ cells, Trem2+ cells, and Gal3+ cells between control and Trem2 cKO mice in LD (n = 4 per group). (J) Percentages of Trem2+ Gal3+ double-positive cells relative to Iba1+ cells between control and Trem2 cKO mice in LD (n = 4 per group). *: P < 0.05; **: P < 0.01; ***: P < 0.001. Two-way ANOVA with Tukey’s post hoc test (I); unpaired Student’s t test (D, E, G, I, and J).

