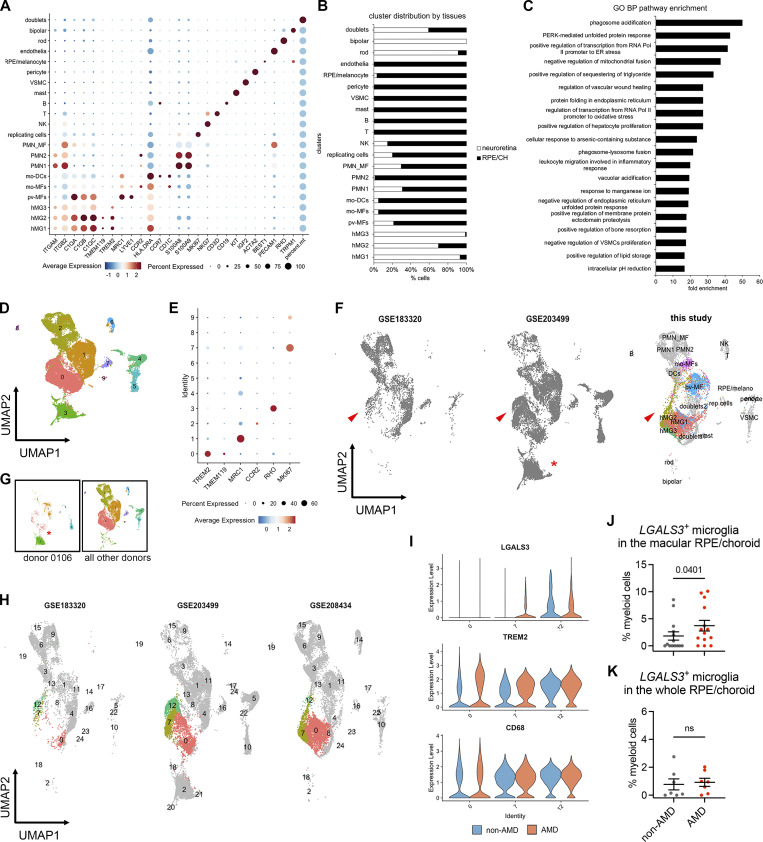
Figure S5.
scRNA-seq analysis of myeloid cells from human non-AMD and AMD donors. (A) Marker expression of all human clusters. hMG, human microglia; mo-MFs, monocyte-derived macrophages; pv-MFs: perivascular macrophages; mo-DCs, monocyte-derived dendritic cells; PMN_MF: doublets of polymorphonuclear neutrophils and macrophages; VSMC, vascular smooth muscle cells; NK, natural killer. (B) Distribution of clusters by neuroretina and RPE/choroid tissues. The cell number of clusters was normalized to the total counts per tissue. (C) Pathway enrichment analysis of subretinal microglia with top 200 shared upregulated genes. The top significant pathways sorted by false discovery and ranked by fold enrichment are shown. GO: Gene Ontology; BP: Biological Process. (D) UMAP plot showing integrated clustering analysis of three independent human AMD datasets. Data are shown with low resolution to reveal major cell types. (E) Dot plot showing the marker expression of major macrophage clusters. Cluster 3 is enriched with RHO expression. (F) UMAP plots show the presence of hMG2 cluster in all three scRNA-seq datasets as indicated by arrowheads. (G) UMAP plots showing the enrichment of cluster 3 in donor 0106_nAMD. (H) UMAP plots showing clustering analysis with high resolution by each dataset and comparable heterogeneity of microglia (cluster 0, 7, and 12). As dataset GSE183320 does not contain neurosensory retina tissues, few cells of major homeostatic microglia (cluster 0) are observed in this dataset. (I) Violin plots show the expression of LGALS3, TREM2, and CD68 by microglial clusters between non-AMD and AMD donors. Both clusters 7 and 12 show LGALS3 upregulation as hMG2 cluster identified in this study. (J and K) Quantifications of LGALS3+ microglial clusters (7 and 12) in the macular and whole RPE/choroid tissues between non-AMD and AMD donors. Data were collected from independent datasets and compared using the Mann-Whitney test. P values are shown. ns: not significant.

