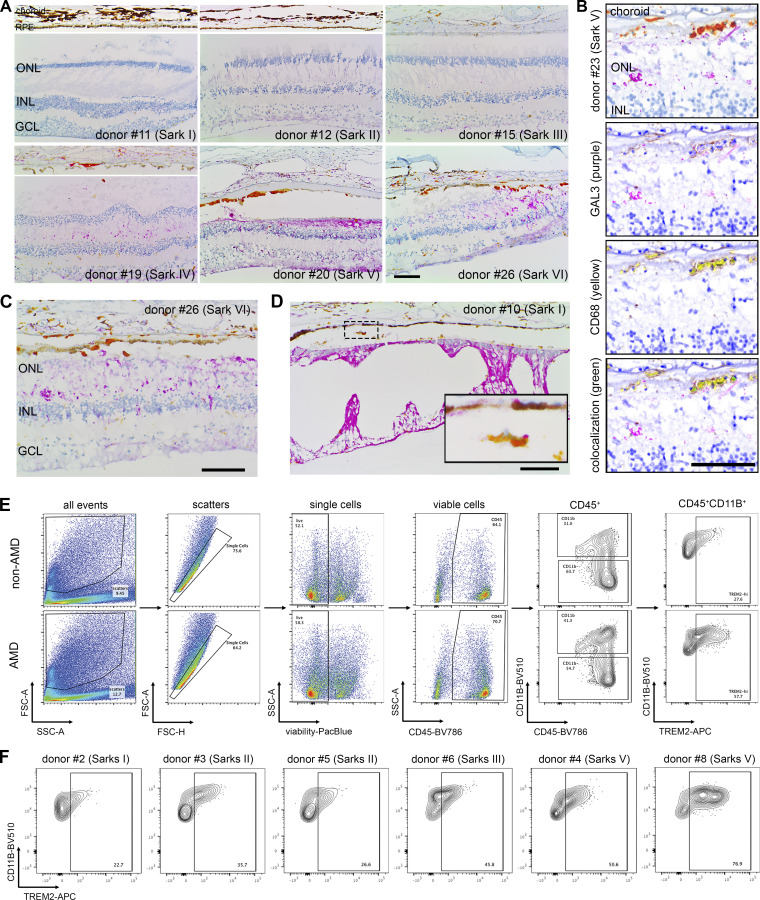
Figure S6.
Validation of GAL3 and TREM2 expression by subretinal myeloid cells in human AMD. (A) Images of GAL3 (purple) and CD68 (yellow) costaining in the macula region of retinal sections from human donors categorized by Sark grades (I–VI). The macular neurosensory retinas of some subject eyes exhibited fixation-related artifactual detachment. In these subjects, separate images of RPE/choroid tissues are shown. Scale bar: 100 μm. INL, inner nuclear layer. GCL, ganglion cell layer. (B) Spectral imaging of GAL3 and CD68 costaining in the geographic atrophy from donor #23 with advanced AMD (Sarks V). Unmixed purple spectrum (GAL3) and yellow spectrum (CD68) are shown. The areas of colocalized spectra are highlighted in green. Scale bar: 50 μm. (C and D) Images showing the presence of subretinal GAL3 (purple) and CD68 (yellow) double-positive cells in the areas with photoreceptor loss and preserved RPE in the transitional area of the macula from an AMD donor (C) and in the age-related peripheral degeneration of a non-AMD donor (D). Scale bars: 100 μm. (E) Gating strategy of flow cytometry analysis. CD45+CD11B+ cells and CD45+CD11B− cells from control blood were used to determine the gating of TREM2+ cells. Concatenated plots are shown for non-AMD and AMD. (F) Flow contour plots of individual donors showing an increased percentage of TREM2+ myeloid cells in AMD.

