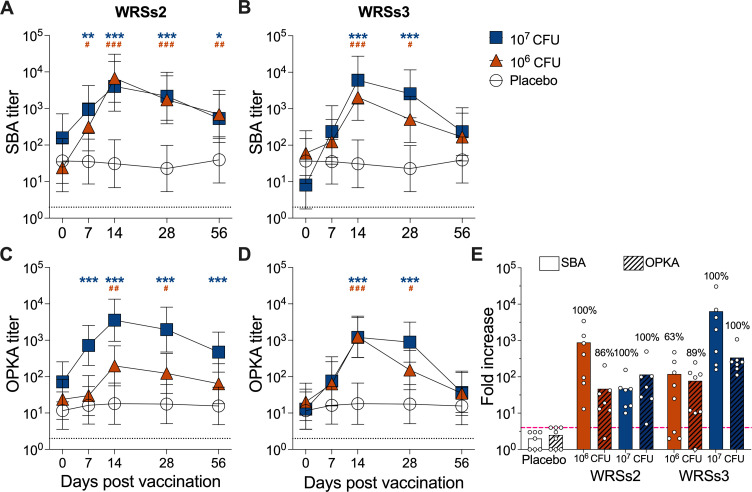
Fig 2.
Kinetics of functional antibody responses in circulation in volunteers orally immunized with Shigella WRSs2 or WRSs3 vaccine strains. SBA and OPKA titers before and after oral immunization with WRSs2 (A, C), WRSs3 (B, D), or placebo. Symbols represent log10 geometric mean titers ± 95% CI. Clear circles represent the placebo group, orange triangles represent individuals vaccinated with the 106 CFU dose, and blue squares represent individuals vaccinated with the 107 CFU dose. Blue asterisks and orange pound signs indicate statistically significant differences for each vaccine/dose response at defined time points as compared to placebo. * and #, P < 0.05; ** and ##, P < 0.01; *** and ###, P < 0.001 determined by linear mixed effect model after log transformation of individual endpoint titers. Dotted line indicates limit of detection (titer of 2 for SBA and OPKA). (E) Largest fold increase in titers over baseline at any day post-vaccination within the treatment groups. Symbols represent individual fold increase in titers. Numbers above bars represent percent of subjects that had ≥4-fold increase (pink dashed line) in antibody titers compared to baseline titers at any time point after vaccination.

