
FIGURE 3.
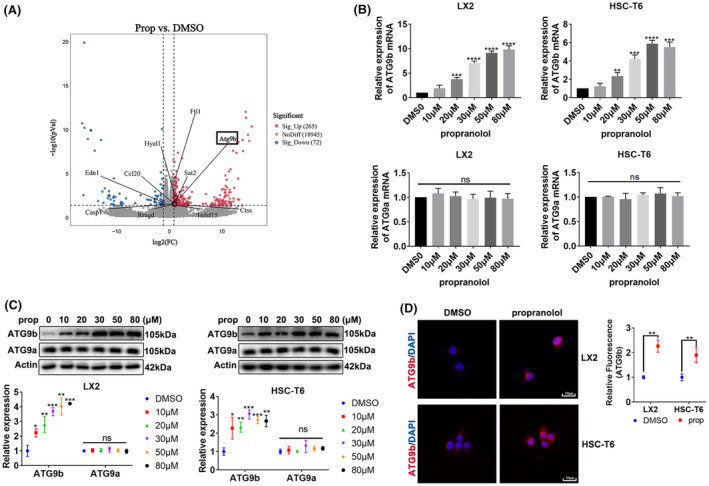
ATG9b was upregulated in propranolol‐treated HSCs. (A) T6 cells were treated with propranolol or DMSO for 24 h, and total RNA was extracted for RNA‐Seq. Hierarchical cluster analyses of significantly differentially expressed mRNAs: bright blue, underexpression; grey, no change; bright red, overexpression. (B, C) LX2 and T6 cells were treated with different concentrations of propranolol for 24 h; the mRNA and protein levels of ATG9b and ATG9a were then determined. (D) LX2 cells were treated with 80 μM propranolol or DMSO, and T6 cells were treated with 50 μM propranolol or DMSO; ATG9b levels were revealed using immunofluorescence. Data are presented as mean ± standard error from three independent experiments (*p < 0.05, **p < 0.01, ***p < 0.001, ****p < 0.001. ns; not significant).